UK Unemployment Rate climbs to 4.2% in quarter to February vs. 4.0% expected
- The UK Unemployment Rate rose to 4.2% in three months to February.
- The Claimant Count Change for Britain stood at 10.9K in March.
- GBP/USD holds the bounce toward 1.2450 after mixed UK jobs data.
The United Kingdom’s (UK) ILO Unemployment Rate came in at 4.2% in the three months to February, rising from 3.9% in the previous period, data published by the Office for National Statistics (ONS) showed Tuesday. The reading missed the market expectations of a 4.0% print.
Additional details of the report showed that the number of people claiming jobless benefits rose by 10.9K in March, as against a revised increase of 4.1K reported in February. The market forecast was for a 17.2K increment in the reported period.
The Employment Change data for February arrived at -156K, compared with January’s -21K.
Average Earnings excluding Bonus in the UK rose 6.0% 3M YoY in February versus January’s 6.1% growth.
Another measure of wage inflation, Average Earnings including Bonus grew 5.6% in the same period, at the same pace seen in the quarter through January and against the expected increase of 5.5%.
The UK Secretary of State for Work and Pensions, Mel Stride MP, told FXStreet: “Our welfare reforms will cut the number of people due to be placed in the highest tier of incapacity benefits by over 370,000 - people we will now be helping back to work.”
“With real wages up again and millions benefiting from this month’s huge boost to the National Minimum Wage, it is work, not welfare, that delivers the best financial security for British households,” Stride added.
GBP/USD reaction to the UK employment report
GBP/USD held on to its modest rebound above 1.2400 after the mixed UK employment data. The pair is trading 0.10% lower on the day at 1.2430, as of writing.
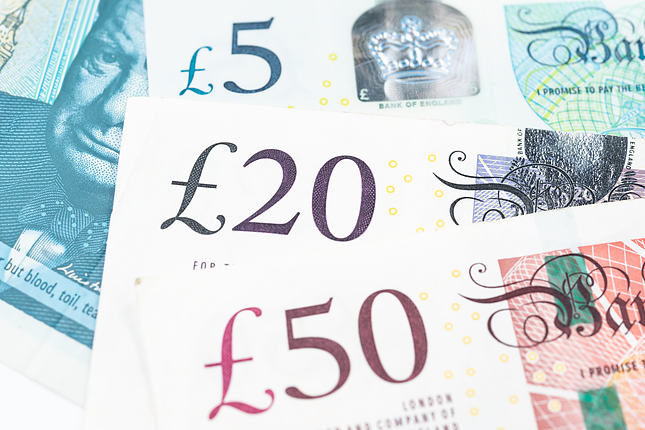
Pound Sterling price today
The table below shows the percentage change of Pound Sterling (GBP) against listed major currencies today. Pound Sterling was the weakest against the US Dollar.
| USD | EUR | GBP | CAD | AUD | JPY | NZD | CHF | |
| USD | 0.06% | 0.08% | 0.05% | 0.26% | 0.07% | 0.19% | 0.05% | |
| EUR | -0.06% | 0.06% | -0.02% | 0.22% | 0.02% | 0.13% | -0.01% | |
| GBP | -0.14% | -0.07% | -0.09% | 0.14% | -0.04% | 0.07% | -0.09% | |
| CAD | -0.06% | 0.00% | 0.07% | 0.19% | 0.01% | 0.13% | -0.02% | |
| AUD | -0.26% | -0.21% | -0.16% | -0.23% | -0.20% | -0.08% | -0.23% | |
| JPY | -0.09% | -0.06% | -0.05% | -0.06% | 0.16% | 0.09% | -0.07% | |
| NZD | -0.20% | -0.14% | -0.07% | -0.14% | 0.08% | -0.11% | -0.14% | |
| CHF | -0.05% | 0.01% | 0.07% | 0.00% | 0.24% | 0.04% | 0.14% |
The heat map shows percentage changes of major currencies against each other. The base currency is picked from the left column, while the quote currency is picked from the top row. For example, if you pick the Euro from the left column and move along the horizontal line to the Japanese Yen, the percentage change displayed in the box will represent EUR (base)/JPY (quote).
Forex News
Keep up with the financial markets, know what's happening and what is affecting the markets with our latest market updates. Analyze market movers, trends and build your trading strategies accordingly.