
Breaking: ADP Employment Change surprised to the downside in February
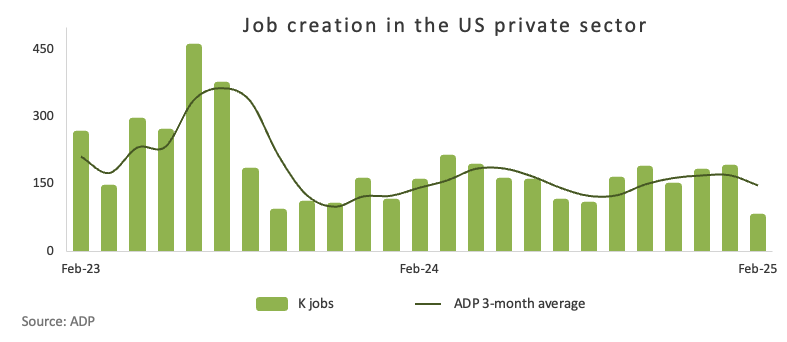
In February, private sector employment in the US grew by just 77K, coming in short of initial estimates of 140K, according to the latest Automatic Data Processing (ADP) report. In addition, the reading was lower than January’s 186K (revised from 183K).
Following the release, Nela Richardson, ADP’s Chief Economist, said that policy uncertainty and a slowdown in consumer spending might have led to layoffs or reduced hiring during the previous month. She noted that ADP’s data, along with other recent indicators, pointed to a cautious approach among employers as they evaluated the economic outlook.
Market reaction
The Greenback extends its decline and challenges the 105.00 support for the first time since early November when tracked by the US Dollar Index (DXY).
US Dollar PRICE Today
The table below shows the percentage change of US Dollar (USD) against listed major currencies today. US Dollar was the strongest against the Japanese Yen.
| USD | EUR | GBP | JPY | CAD | AUD | NZD | CHF | |
|---|---|---|---|---|---|---|---|---|
| USD | -0.88% | -0.27% | 0.10% | -0.53% | -0.51% | -0.59% | -0.01% | |
| EUR | 0.88% | 0.62% | 0.99% | 0.35% | 0.37% | 0.29% | 0.89% | |
| GBP | 0.27% | -0.62% | 0.34% | -0.26% | -0.25% | -0.33% | 0.26% | |
| JPY | -0.10% | -0.99% | -0.34% | -0.64% | -0.64% | -0.72% | -0.12% | |
| CAD | 0.53% | -0.35% | 0.26% | 0.64% | 0.02% | -0.06% | 0.53% | |
| AUD | 0.51% | -0.37% | 0.25% | 0.64% | -0.02% | -0.07% | 0.52% | |
| NZD | 0.59% | -0.29% | 0.33% | 0.72% | 0.06% | 0.07% | 0.60% | |
| CHF | 0.00% | -0.89% | -0.26% | 0.12% | -0.53% | -0.52% | -0.60% |
The heat map shows percentage changes of major currencies against each other. The base currency is picked from the left column, while the quote currency is picked from the top row. For example, if you pick the US Dollar from the left column and move along the horizontal line to the Japanese Yen, the percentage change displayed in the box will represent USD (base)/JPY (quote).
This section below was published as a preview of the US ADP Employment Change data at 08:30 GMT.
- The ADP Employment Change, and the US labour market, take centre stage this week.
- The US private sector is seen adding 140K new jobs in February.
- The US Dollar Index continues to trade in the lower end of the range.
The US labor market is set to take center stage this week as fresh concerns mount that the economy may be losing its momentum — a sentiment echoed by recent slower growth and worrisome fundamental data.
In the spotlight, the ADP Research Institute is poised to release its February Employment Change report on Wednesday, offering a snapshot of private-sector job creation.
Typically coming out two days before the official Nonfarm Payrolls (NFP) report, the ADP survey is often seen as an early indicator of trends expected in the Bureau of Labor Statistics (BLS) jobs report — even if the two don't always tell the same story.
The economic equation: Job growth and Fed policy in focus
Employment is critical as it forms one of the two legs of the Federal Reserve’s (Fed) dual mandate. The US central bank is tasked with maintaining price stability while pursuing maximum employment. As inflationary pressures remain stubborn, the focus appears to have temporarily shifted to the performance of the US labour market following the Fed’s hawkish stance at its January 28–29 meeting.
In the meantime, investors continue to closely monitor the White House’s trade policies and their consequences, particularly after US tariffs on Canadian and Mexican imports took effect on March 4. Fears that these levies could fan the flames of a resurgence in inflationary pressure have driven both the Fed’s prudent approach and the cautious remarks from many of its policymakers.
So far, and in light of the recent set of weaker-than-expected results that have challenged the notion of US “exceptionalism”, market participants now expect the Fed to reduce interest rates by 50 basis points this year.
Amid the ongoing tariff turmoil, the apparent slowing momentum of the US economy, and persistent consumer price pressures, the ADP report — and especially Friday’s Nonfarm Payrolls report — has gained renewed relevance and could help shape the Fed’s next move.
When will the ADP Report be released, and how could it affect the US Dollar Index?
The ADP Employment Change report for February is set to drop on Wednesday at 13:15 GMT with forecasts pointing to an addition of 140K new jobs following January’s gain of 183K. In anticipation, the US Dollar Index (DXY) remains securely on the defensive, putting the key support at 106.00 to the test amid rising jitters over the US economy.
If the ADP report delivers robust numbers, it could momentarily cool the mounting concerns over the US economic slowdown. However, if the results fall short of expectations, it might reinforce worries that the economy is losing momentum—potentially prompting the Fed to reconsider an earlier restart of its easing cycle.
According to Pablo Piovano, Senior Analyst at FXStreet, “If the recovery gains traction, the DXY could revisit the weekly peak of 107.66 (February 28), a region that appears reinforced by the proximity of the transitory 55-day SMA around 107.90, ahead of the February high of 109.88 set on February 3, and the YTD peak of 110.17 from January 13. Surpassing that level might pave the way toward the next resistance at the 2022 high of 114.77 recorded on September 28.
“On the flip side, if sellers manage to seize control, the index might first find support at the 2025 bottom of 105.89 reached on March 4, prior to the December 2024 bottom of 105.42, and eventually at the critical 200-day SMA in the 105.00 zone. Staying above that key threshold is essential for sustaining bullish momentum,” Piovano concludes.
GDP FAQs
A country’s Gross Domestic Product (GDP) measures the rate of growth of its economy over a given period of time, usually a quarter. The most reliable figures are those that compare GDP to the previous quarter e.g Q2 of 2023 vs Q1 of 2023, or to the same period in the previous year, e.g Q2 of 2023 vs Q2 of 2022. Annualized quarterly GDP figures extrapolate the growth rate of the quarter as if it were constant for the rest of the year. These can be misleading, however, if temporary shocks impact growth in one quarter but are unlikely to last all year – such as happened in the first quarter of 2020 at the outbreak of the covid pandemic, when growth plummeted.
A higher GDP result is generally positive for a nation’s currency as it reflects a growing economy, which is more likely to produce goods and services that can be exported, as well as attracting higher foreign investment. By the same token, when GDP falls it is usually negative for the currency. When an economy grows people tend to spend more, which leads to inflation. The country’s central bank then has to put up interest rates to combat the inflation with the side effect of attracting more capital inflows from global investors, thus helping the local currency appreciate.
When an economy grows and GDP is rising, people tend to spend more which leads to inflation. The country’s central bank then has to put up interest rates to combat the inflation. Higher interest rates are negative for Gold because they increase the opportunity-cost of holding Gold versus placing the money in a cash deposit account. Therefore, a higher GDP growth rate is usually a bearish factor for Gold price.
Fed FAQs
Monetary policy in the US is shaped by the Federal Reserve (Fed). The Fed has two mandates: to achieve price stability and foster full employment. Its primary tool to achieve these goals is by adjusting interest rates. When prices are rising too quickly and inflation is above the Fed’s 2% target, it raises interest rates, increasing borrowing costs throughout the economy. This results in a stronger US Dollar (USD) as it makes the US a more attractive place for international investors to park their money. When inflation falls below 2% or the Unemployment Rate is too high, the Fed may lower interest rates to encourage borrowing, which weighs on the Greenback.
The Federal Reserve (Fed) holds eight policy meetings a year, where the Federal Open Market Committee (FOMC) assesses economic conditions and makes monetary policy decisions. The FOMC is attended by twelve Fed officials – the seven members of the Board of Governors, the president of the Federal Reserve Bank of New York, and four of the remaining eleven regional Reserve Bank presidents, who serve one-year terms on a rotating basis.
In extreme situations, the Federal Reserve may resort to a policy named Quantitative Easing (QE). QE is the process by which the Fed substantially increases the flow of credit in a stuck financial system. It is a non-standard policy measure used during crises or when inflation is extremely low. It was the Fed’s weapon of choice during the Great Financial Crisis in 2008. It involves the Fed printing more Dollars and using them to buy high grade bonds from financial institutions. QE usually weakens the US Dollar.
Quantitative tightening (QT) is the reverse process of QE, whereby the Federal Reserve stops buying bonds from financial institutions and does not reinvest the principal from the bonds it holds maturing, to purchase new bonds. It is usually positive for the value of the US Dollar.
Forex News
Keep up with the financial markets, know what's happening and what is affecting the markets with our latest market updates. Analyze market movers, trends and build your trading strategies accordingly.