Gold price climbs further beyond $2,900; reverses major part of Monday's fall to one-week low
- Gold price rebounds from a one-week low and draws support from a combination of factors.
- Global trade war fears and geopolitical risks continue to underpin the safe-haven commodity.
- Fed rate cut bets keep the USD depressed and further benefit the non-yielding XAU/USD pair.
Gold price (XAU/USD) builds on its intraday ascent beyond the $2,900 mark, hitting a fresh daily high during the first half of the European session and reversing a major the previous day's losses to a one-week low. Investors remain worried about the potential economic fallout from US President Donald Trump's trade tariffs and persistent geopolitical risks. This continues to fuel the global risk-aversion trade and helps revive demand for the safe-haven bullion.
Meanwhile, expectations that a tariff-driven slowdown in US growth might force the Federal Reserve (Fed) to cut interest rates multiple times this year keep the US Treasury bond yields depressed. This, in turn, drags the US Dollar (USD) back closer to a multi-month low and turns out to be another factor benefiting the non-yielding Gold price. Traders, however, might refrain from placing fresh bullish bets around the XAU/USD ahead of the US inflation figures this week.
Daily Digest Market Movers: Gold price bulls retain intraday control amid the fligth to safety, weaker USD
- Investors continue to take refuge in traditional safe-haven assets amid concerns about US President Donald Trump's trade tariffs, assisting the Gold price to rebound from a one-week trough touched on Monday. In fact, Trump's 25% tariffs on global steel and aluminum imports go into effect on Wednesday. Furthermore, the Trump administration is preparing for other levies planned for April 2.
- Markets remain worried about a potential US recession on the back of Trump's protectionist policies. Adding to this, signs of a weakening US labor market fuel speculations that the Federal Reserve would resume its rate-cutting cycle in June. This keeps the US Treasury bond yields depressed and the US Dollar close to a multi-month low, further lending support to the non-yielding yellow metal.
- Ukrainian President Volodymyr Zelenskiy's meeting with Trump at the Oval Office on February 28 ended in disaster, leading to the US suspending all military aid to Ukraine. Hence, investors brace for more geopolitical action at a meeting between US officials and their Ukrainian counterparts starting today. This, in turn, could play a key role in influencing the XAU/USD pair's price action.
- Hours ahead of the US-Ukraine Summit on minerals and peace deal, Ukraine launched record drone attacks on Russia’s capital, Moscow. Moscow Mayor Sergei Sobyanin said that Russian air defense units destroyed at least 11 Ukrainian drones flying towards the Ramenskoye and Domodedovo districts, which lie about 40 km (25 miles) to 50 km (30 miles) south and southeast of the Kremlin.
- Later during the North American session, traders will take cues from the release of the Job Openings and Labor Turnover Survey (JOLTS) from the US. The focus, however, will remain on the US inflation figures – the Consumer Price Index (CPI) on Wednesday and the Producer Price Index (PPI) on Thursday. This will drive the USD and determine the near-term trajectory for the precious metal.
Gold price needs to surpass the $2,922-$2,924 horizontal barrier to support prospects for additional gains
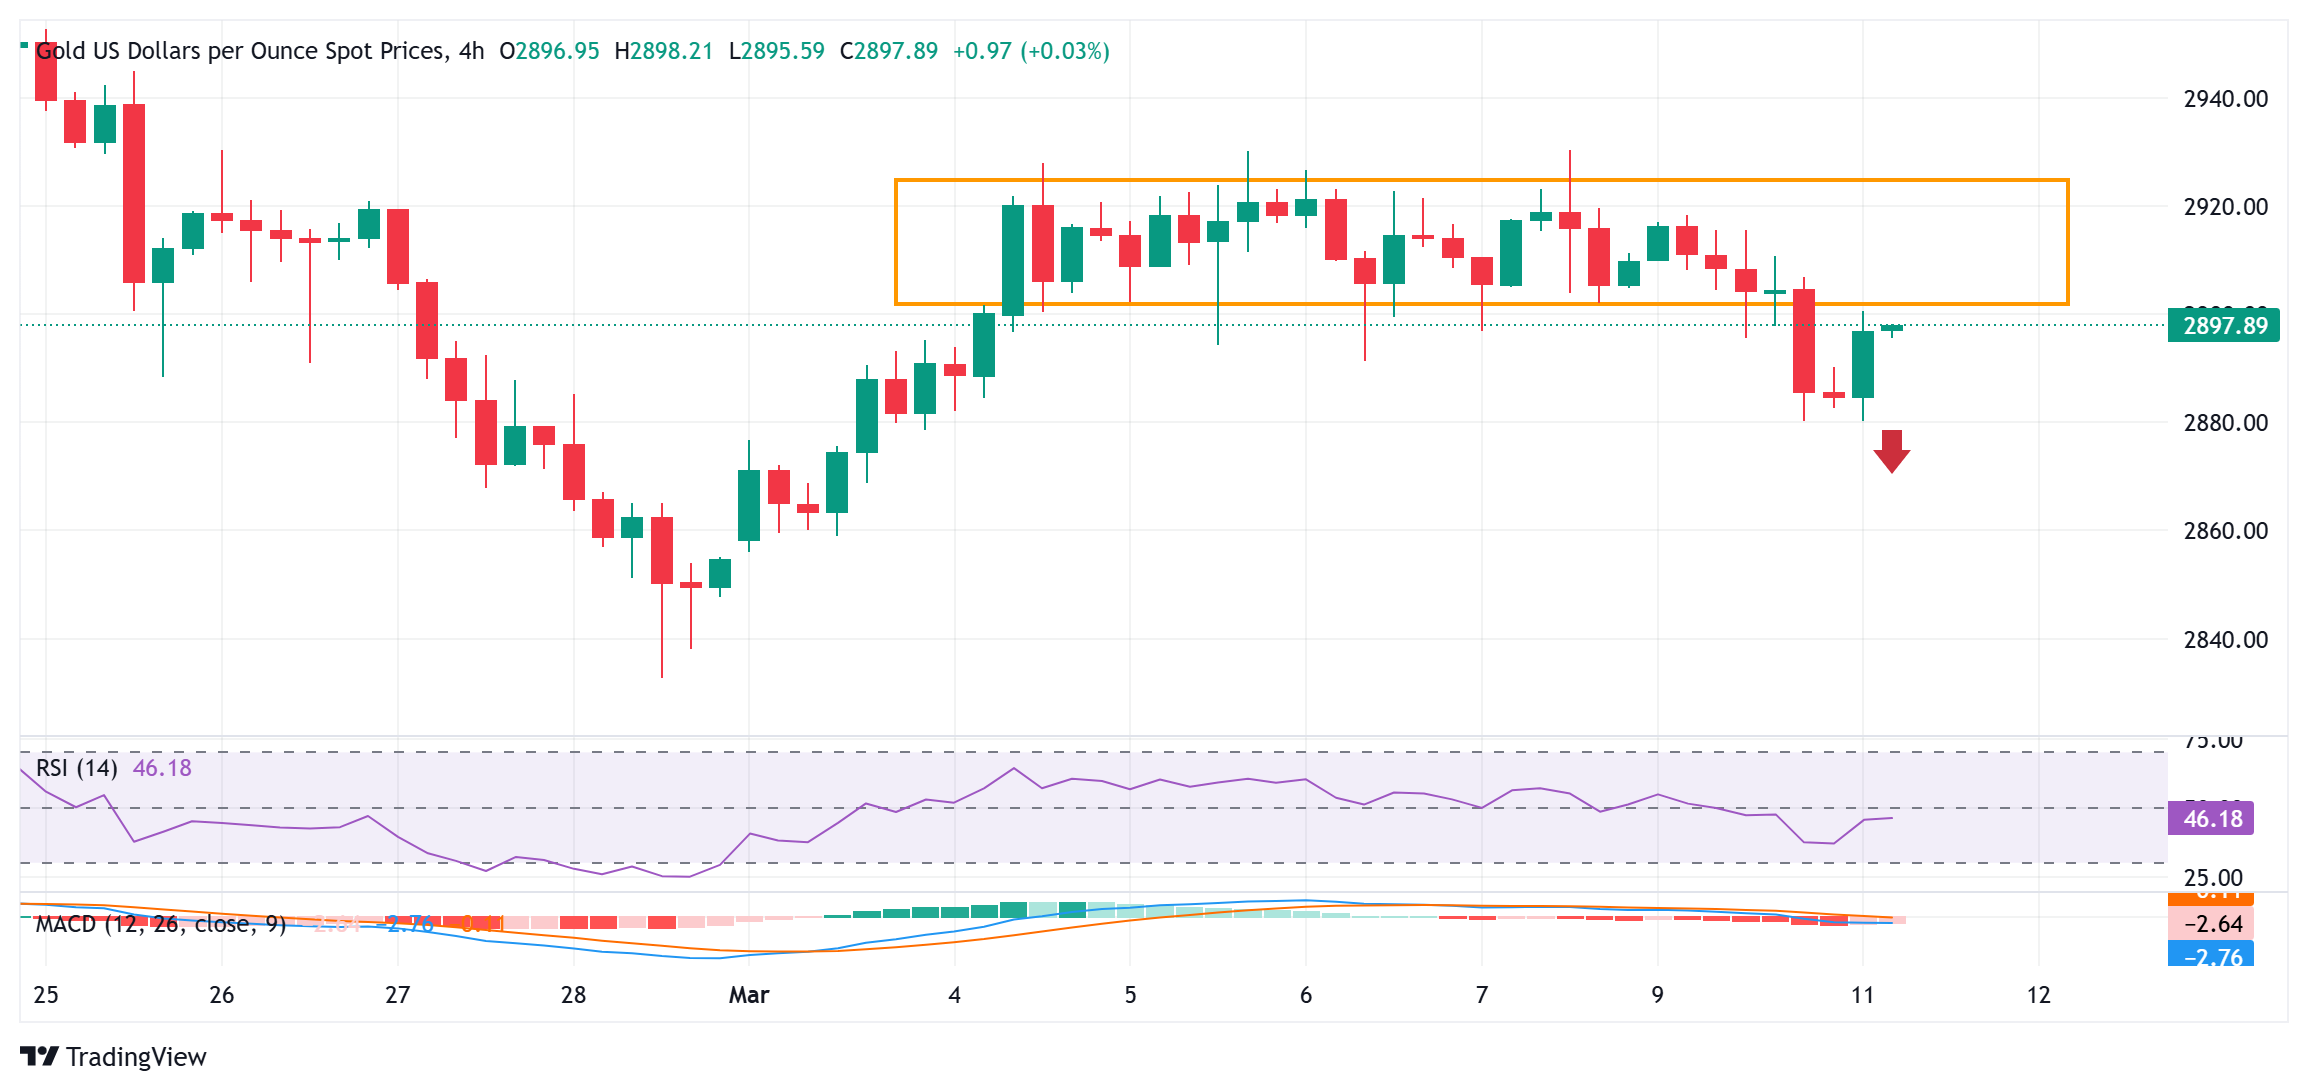
From a technical perspective, the overnight breakdown and close below the $2,900 round figure, or the lower end of a short-term trading range, could be seen as a key trigger for bearish traders. That said, mixed oscillators on the daily chart make it prudent to wait for some follow-through selling below the $2,880 region, or the one-week low, before positioning for further losses. The subsequent downfall could drag the Gold price to the $2,860 intermediate support en route to the late February swing low, around the $2,833-2,832 region, and the $2,800 mark.
On the flip side, any further move up beyond the $2,900 round figure is likely to face some resistance near the $2,922-2,924 area. A sustained strength beyond the said barrier could lift the Gold price beyond the $2,934 resistance, towards retesting the record high, around the $2,956 region touched on February 24.
Economic Indicator
Consumer Price Index (YoY)
Inflationary or deflationary tendencies are measured by periodically summing the prices of a basket of representative goods and services and presenting the data as The Consumer Price Index (CPI). CPI data is compiled on a monthly basis and released by the US Department of Labor Statistics. The YoY reading compares the prices of goods in the reference month to the same month a year earlier.The CPI is a key indicator to measure inflation and changes in purchasing trends. Generally speaking, a high reading is seen as bullish for the US Dollar (USD), while a low reading is seen as bearish.
Read more.Next release: Wed Mar 12, 2025 12:30
Frequency: Monthly
Consensus: 2.9%
Previous: 3%
Source: US Bureau of Labor Statistics
The US Federal Reserve has a dual mandate of maintaining price stability and maximum employment. According to such mandate, inflation should be at around 2% YoY and has become the weakest pillar of the central bank’s directive ever since the world suffered a pandemic, which extends to these days. Price pressures keep rising amid supply-chain issues and bottlenecks, with the Consumer Price Index (CPI) hanging at multi-decade highs. The Fed has already taken measures to tame inflation and is expected to maintain an aggressive stance in the foreseeable future.
Forex News
Keep up with the financial markets, know what's happening and what is affecting the markets with our latest market updates. Analyze market movers, trends and build your trading strategies accordingly.