
USD/CAD Price Forecast: Falls toward 1.4250 after breaking below a crucial support zone
- USD/CAD may navigate near the three-month low of 1.4151.
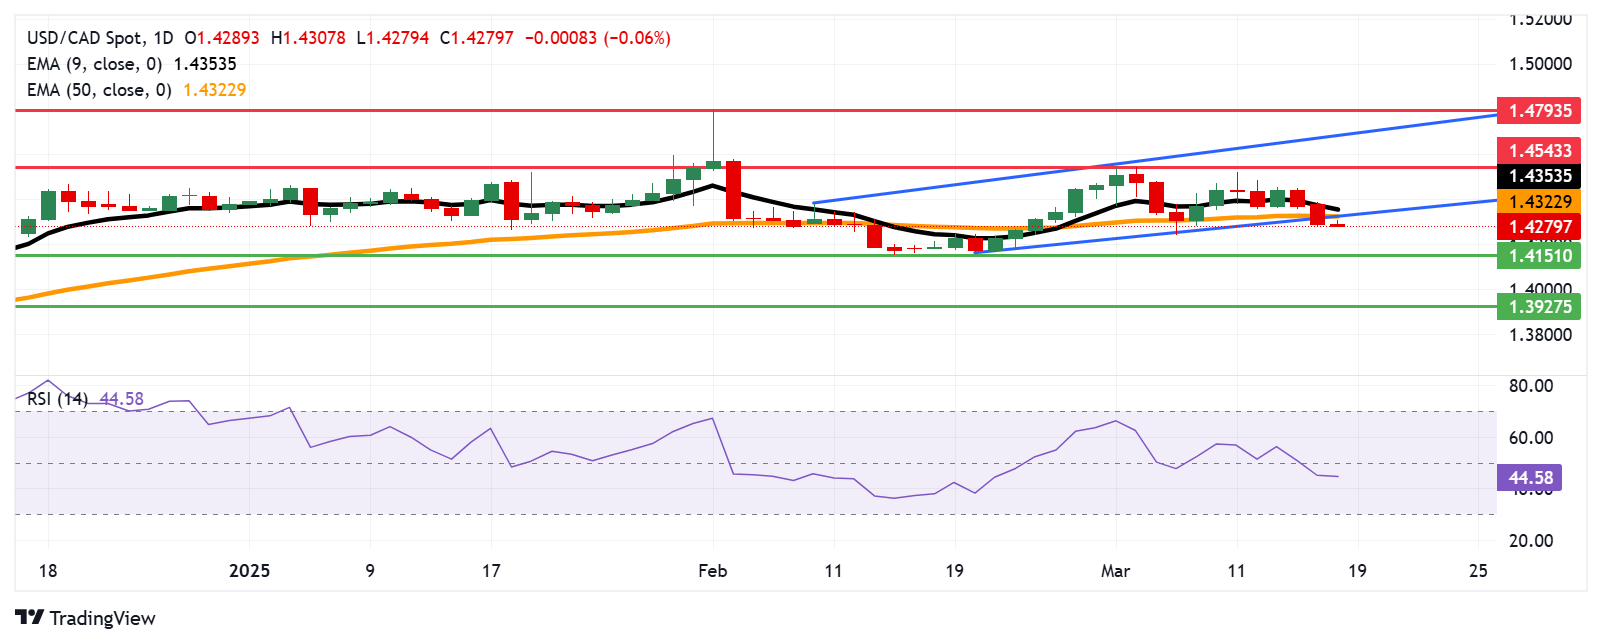
- A break below the ascending channel pattern suggests a shift to bearish sentiment.
- Immediate resistance stands at the psychological level of 1.4300, followed by the 50-day EMA at 1.4323.
USD/CAD continues its losing streak for the third successive session, trading near 1.4290 during European hours on Tuesday. Technical analysis on the daily chart indicates a breakdown below an ascending channel pattern, signaling a shift toward bearish sentiment.
The 14-day Relative Strength Index (RSI) remains below 50, confirming the bearish outlook prevails. Additionally, the USD/CAD pair is trading below the nine-day Exponential Moving Average (EMA), suggesting weak short-term price momentum.
A break below the ascending channel has weakened the market sentiment and put downward pressure on the USD/CAD pair to navigate the area around the three-month low of 1.4151, last seen on February 14.
On the upside, immediate resistance is at the psychological level of 1.4300, followed by the 50-day EMA at 1.4322 and the nine-day EMA at 1.4353. A break above this resistance zone could strengthen short-term price momentum, potentially driving the USD/CAD pair toward the monthly high of 1.4543, recorded on March 4.
Further resistance is seen at the upper boundary of the ascending channel at 1.4700. A breakout above this level could reinforce the bullish bias and pave the way for a test of 1.4793, the highest level since March 2003, reached on February 3.
USD/CAD: Daily Chart
Canadian Dollar PRICE Today
The table below shows the percentage change of Canadian Dollar (CAD) against listed major currencies today. Canadian Dollar was the strongest against the Japanese Yen.
| USD | EUR | GBP | JPY | CAD | AUD | NZD | CHF | |
|---|---|---|---|---|---|---|---|---|
| USD | -0.26% | -0.07% | 0.45% | -0.06% | -0.05% | -0.14% | -0.12% | |
| EUR | 0.26% | 0.17% | 0.72% | 0.19% | 0.20% | 0.12% | 0.13% | |
| GBP | 0.07% | -0.17% | 0.53% | 0.03% | 0.03% | -0.05% | -0.04% | |
| JPY | -0.45% | -0.72% | -0.53% | -0.52% | -0.49% | -0.61% | -0.58% | |
| CAD | 0.06% | -0.19% | -0.03% | 0.52% | 0.02% | -0.07% | -0.07% | |
| AUD | 0.05% | -0.20% | -0.03% | 0.49% | -0.02% | -0.09% | -0.08% | |
| NZD | 0.14% | -0.12% | 0.05% | 0.61% | 0.07% | 0.09% | 0.01% | |
| CHF | 0.12% | -0.13% | 0.04% | 0.58% | 0.07% | 0.08% | -0.01% |
The heat map shows percentage changes of major currencies against each other. The base currency is picked from the left column, while the quote currency is picked from the top row. For example, if you pick the Canadian Dollar from the left column and move along the horizontal line to the US Dollar, the percentage change displayed in the box will represent CAD (base)/USD (quote).
Forex News
Keep up with the financial markets, know what's happening and what is affecting the markets with our latest market updates. Analyze market movers, trends and build your trading strategies accordingly.