USD/CAD Price Forecast: Bearish Hanging Man reversal pattern confirmed
- USD/CAD formed a Japanese candlestick reversal pattern on Wednesday.
- Price could be about to fall in a large ABC or Measured Move price pattern.
USD/CAD formed a Hanging Man candlestick reversal pattern (blue rectangle on chart below) on Wednesday which suggests more downside is likely for the pair in the near-term. The pattern gained confirmation after Thursday ended as a long, red, down day.
USD/CAD Daily Chart
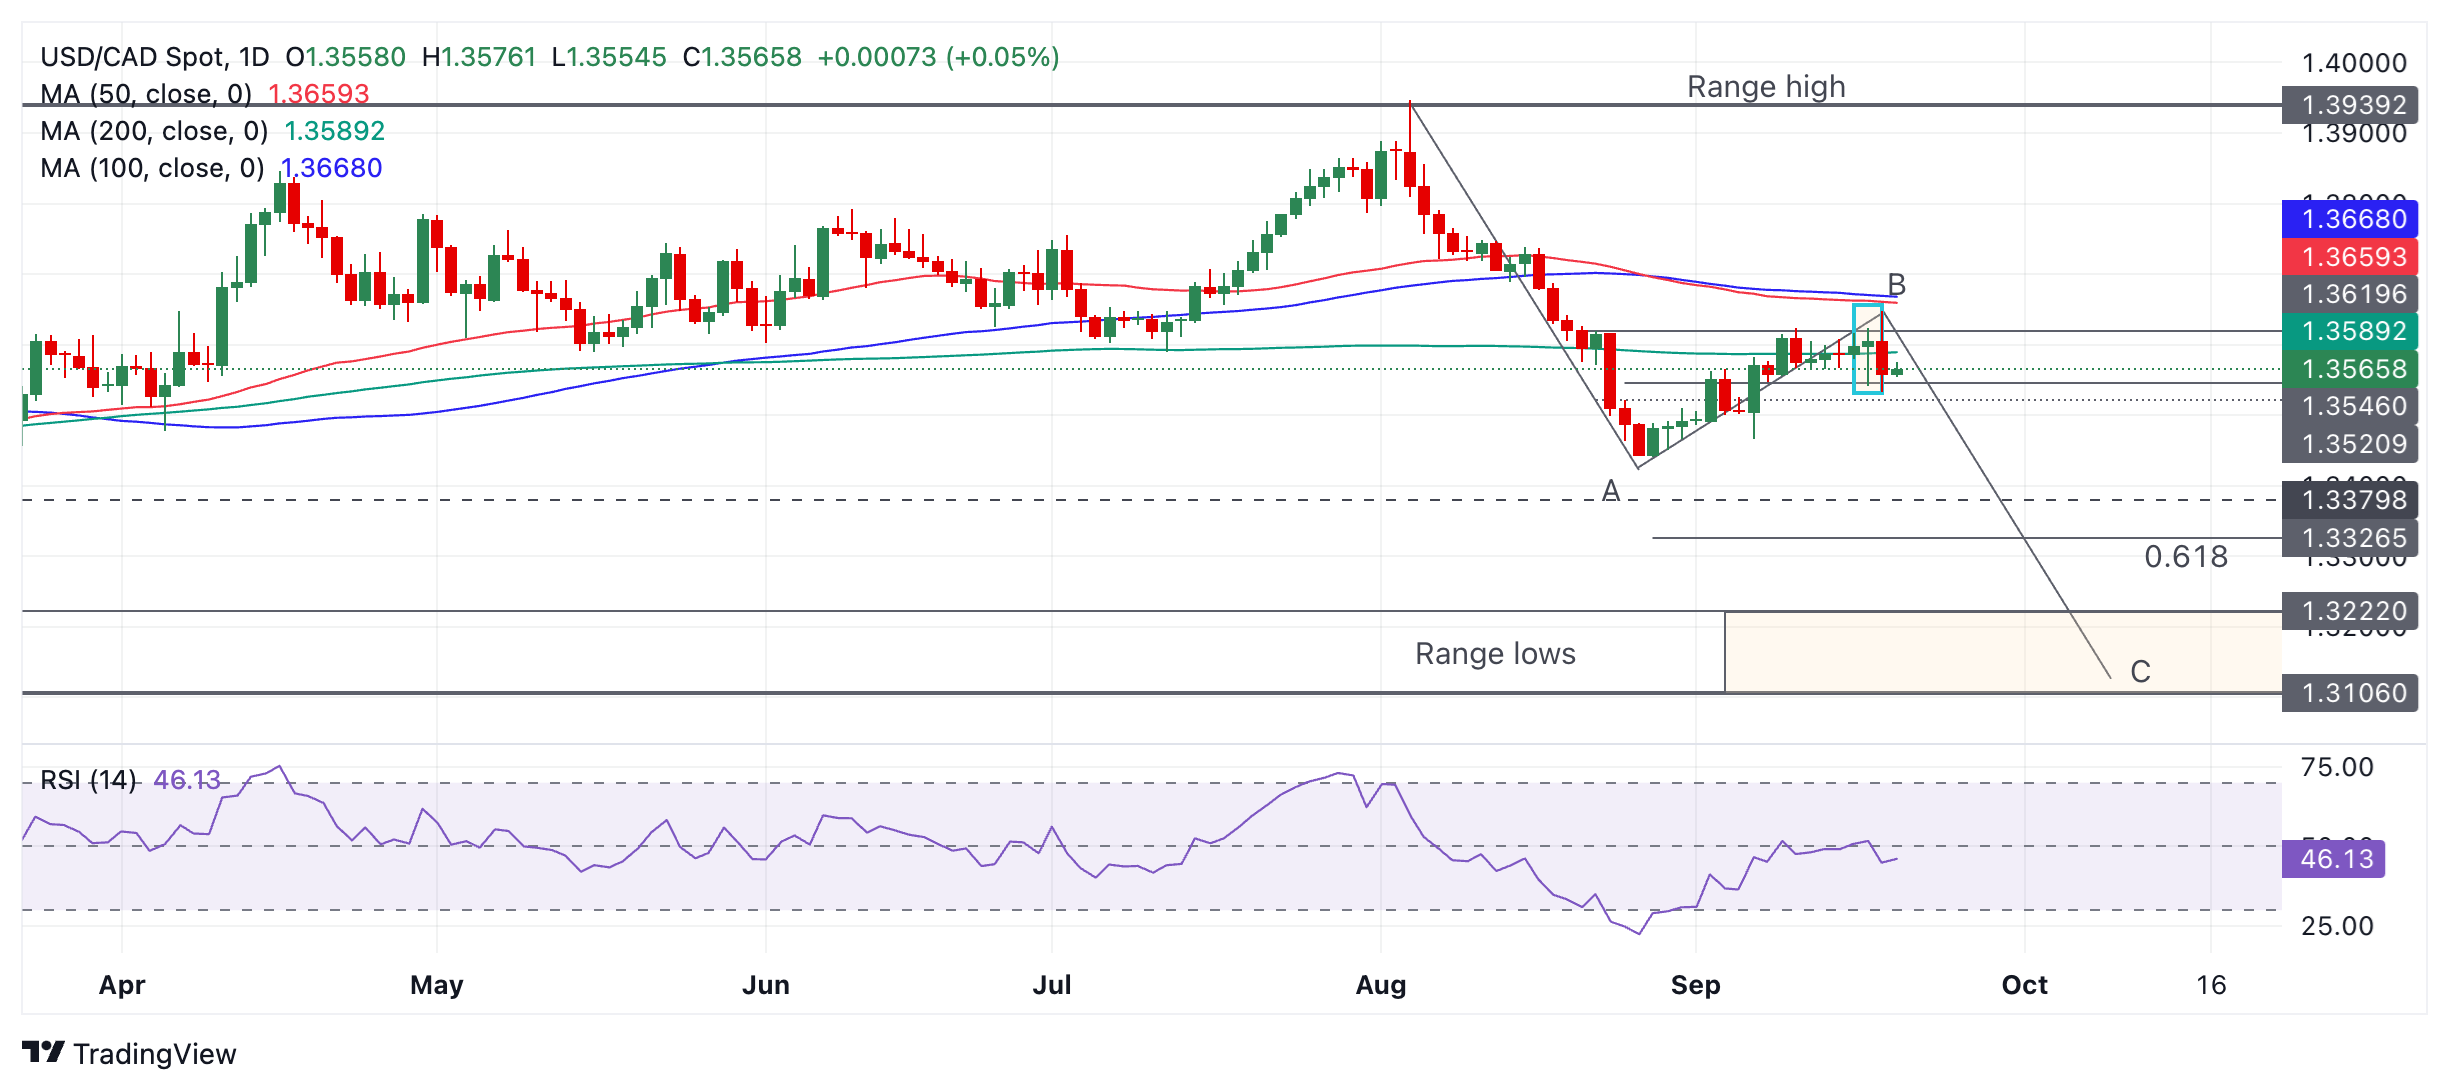
The Hanging Man forms when price rises to a new higher high, pulls back down during the same day, then recovers again and closes the day close to where it opened. If it is followed by a red down day – as was the case with USD/CAD – a short-term bearish reversal is heralded.
USD/CAD’s move down from the range high looks like it is conforming to an ABC pattern, or “Measured Move” (see labels on chart above). Such patterns are like large zig-zags. The wave C usually reaches a similar length to wave A or at a minimum is a Fibonacci 61.8% of A.
If USD/CAD is really forming an ABC pattern then wave C is probably about to unfold and go substantially lower. Such a down leg would probably fall to the zone of the range lows (orange shaded rectangle on chart above). The 61.8% target, meanwhile, lies at 1.3326.
It is still a little early to be sure that USD/CAD has reversed and will fall further. A break below 1.3533 (September 19 low) would provide added bearish confirmation, and a break below 1.3466 (September 6) even more solid confirmation.
Forex News
Keep up with the financial markets, know what's happening and what is affecting the markets with our latest market updates. Analyze market movers, trends and build your trading strategies accordingly.