Dow Jones Industrial Average snaps win streak, caps off downside run with over 250 points loss on Friday
- The Dow Jones shed seven-tenths of a percent on Friday at its lowest.
- A tech stock rally left the Dow in the dust as the blue-chip index waffles.
- Despite holding on the high end, the Dow Jones found its first down week since August.
The Dow Jones Industrial Average (DJIA) bottomed out around 300 points on Friday, easing back 0.7% at the low point as a broad tech rally left the Dow to fend for itself. A meager recovery late Friday did little to recover equity stance to wrap up the trading week, finishing Friday down over 250 points, or 0.6% percent. The major index shed 2.7% over the week as key stocks ease back into the midrange following a bumper earnings season.
Stocks are struggling overall under the weight of marginally higher bond yields, which have taken a step up recently. Despite cooling off on Friday, with the 10-year Treasury yield easing back toward 4.2% after breaking north of 4.25% during the midweek market sessions, stocks are grappling with buoyed bond yields as the two markets tend to move in opposite directions.
Tesla (TSLA) has extended a rally after quarterly revenue came in higher than expected, helping to bolster a broad-market rally in the tech sector. Major digital darlings including Meta (META) and Netflix (NFLX) also rose on Friday, gaining more than 1% each.
Dow Jones news
Two-thirds of securities listed on the Dow Jones are testing into the low end on Friday, though a knock-on tech rally helped to bolster Intel (INTC) over 2.5% to $23 per share. The tech and AI bubble also found room for Salesforce (CRM), which rose 1.2% and crossed over $290 per share. On the low end, McDonald’s (MCD) shed nearly 3%, falling below $293 per share, with Goldman Sachs (GS) close behind, backsliding around 2.25% and easing below $513 per share. Both companies posted above-forecast revenue reporting recently, prompting an earnings season splurge, but markets are now pulling back their revenue bids.
Dow Jones price forecast
The Dow Jones spent most of the trading week grinding lower toward the 42,000 handle as the major stock index takes a break from 2024’s overall stellar performance. The equity board has snapped a six-week win streak, but is still firmly planted in bull country as markets take a breather and pull back from 43,000.
Oscillating technical indicators remain hopelessly broken as the Dow Jones sets record highs weekly more often than not. Price action has entirely outrun long-term moving averages, with bids testing chart paper well above the 200-day Exponential Moving Average (EMA), struggling to rise to 35,000.
Dow Jones daily chart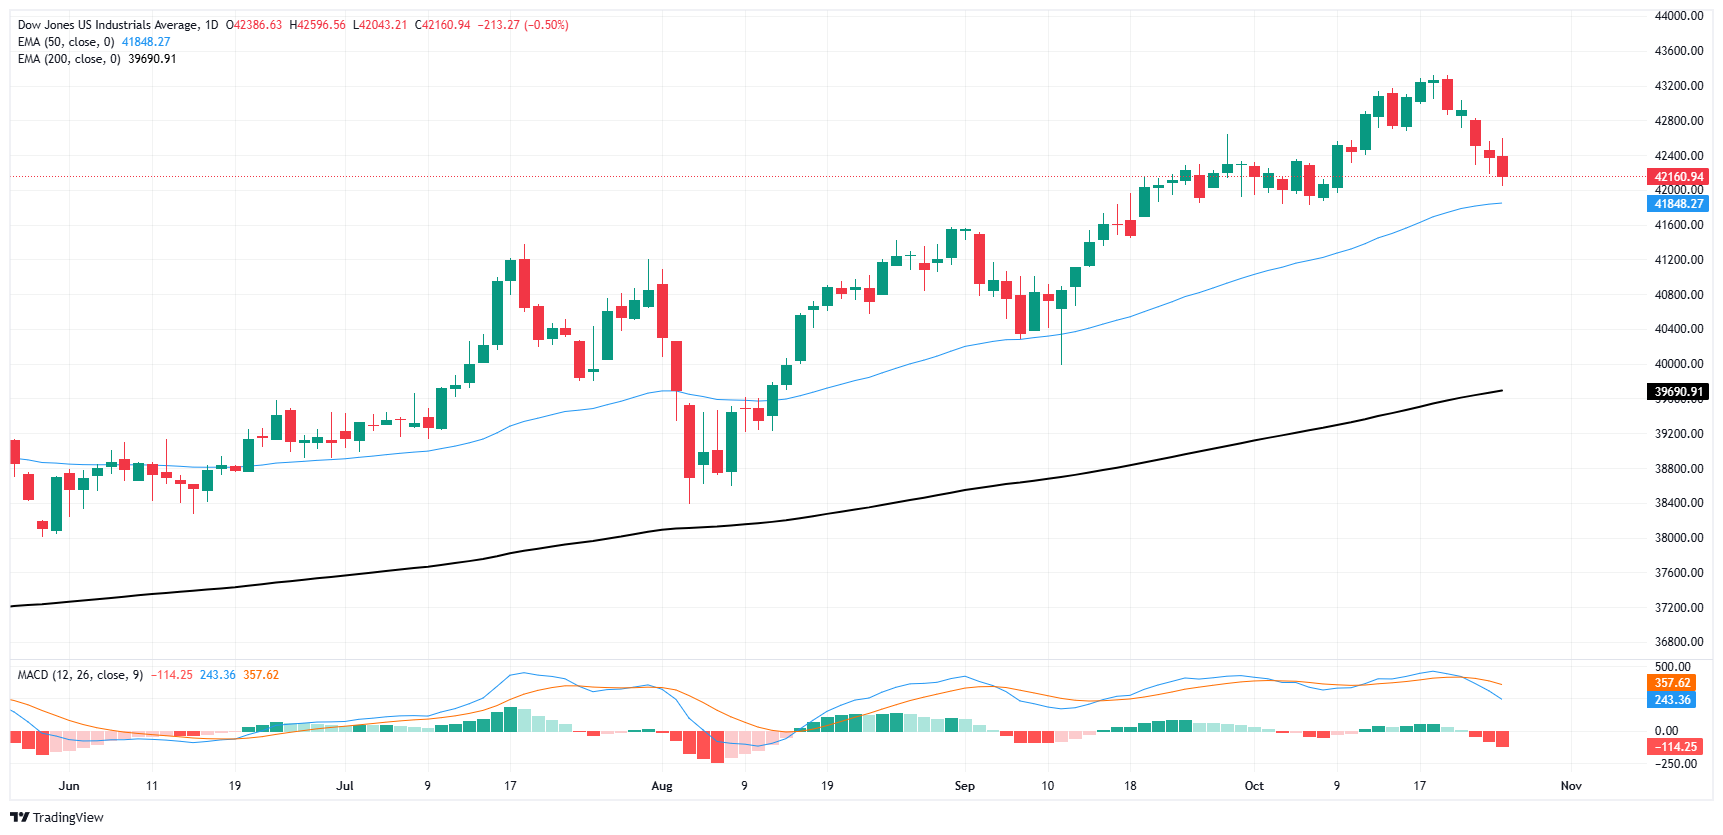
Dow Jones FAQs
The Dow Jones Industrial Average, one of the oldest stock market indices in the world, is compiled of the 30 most traded stocks in the US. The index is price-weighted rather than weighted by capitalization. It is calculated by summing the prices of the constituent stocks and dividing them by a factor, currently 0.152. The index was founded by Charles Dow, who also founded the Wall Street Journal. In later years it has been criticized for not being broadly representative enough because it only tracks 30 conglomerates, unlike broader indices such as the S&P 500.
Many different factors drive the Dow Jones Industrial Average (DJIA). The aggregate performance of the component companies revealed in quarterly company earnings reports is the main one. US and global macroeconomic data also contributes as it impacts on investor sentiment. The level of interest rates, set by the Federal Reserve (Fed), also influences the DJIA as it affects the cost of credit, on which many corporations are heavily reliant. Therefore, inflation can be a major driver as well as other metrics which impact the Fed decisions.
Dow Theory is a method for identifying the primary trend of the stock market developed by Charles Dow. A key step is to compare the direction of the Dow Jones Industrial Average (DJIA) and the Dow Jones Transportation Average (DJTA) and only follow trends where both are moving in the same direction. Volume is a confirmatory criteria. The theory uses elements of peak and trough analysis. Dow’s theory posits three trend phases: accumulation, when smart money starts buying or selling; public participation, when the wider public joins in; and distribution, when the smart money exits.
There are a number of ways to trade the DJIA. One is to use ETFs which allow investors to trade the DJIA as a single security, rather than having to buy shares in all 30 constituent companies. A leading example is the SPDR Dow Jones Industrial Average ETF (DIA). DJIA futures contracts enable traders to speculate on the future value of the index and Options provide the right, but not the obligation, to buy or sell the index at a predetermined price in the future. Mutual funds enable investors to buy a share of a diversified portfolio of DJIA stocks thus providing exposure to the overall index.
Forex News
Keep up with the financial markets, know what's happening and what is affecting the markets with our latest market updates. Analyze market movers, trends and build your trading strategies accordingly.