
NZD/JPY Price Analysis: Selling pressure emerges after bearish SMA crossover
- The NZD/JPY has been trading sideways recently, showing no clear trend.
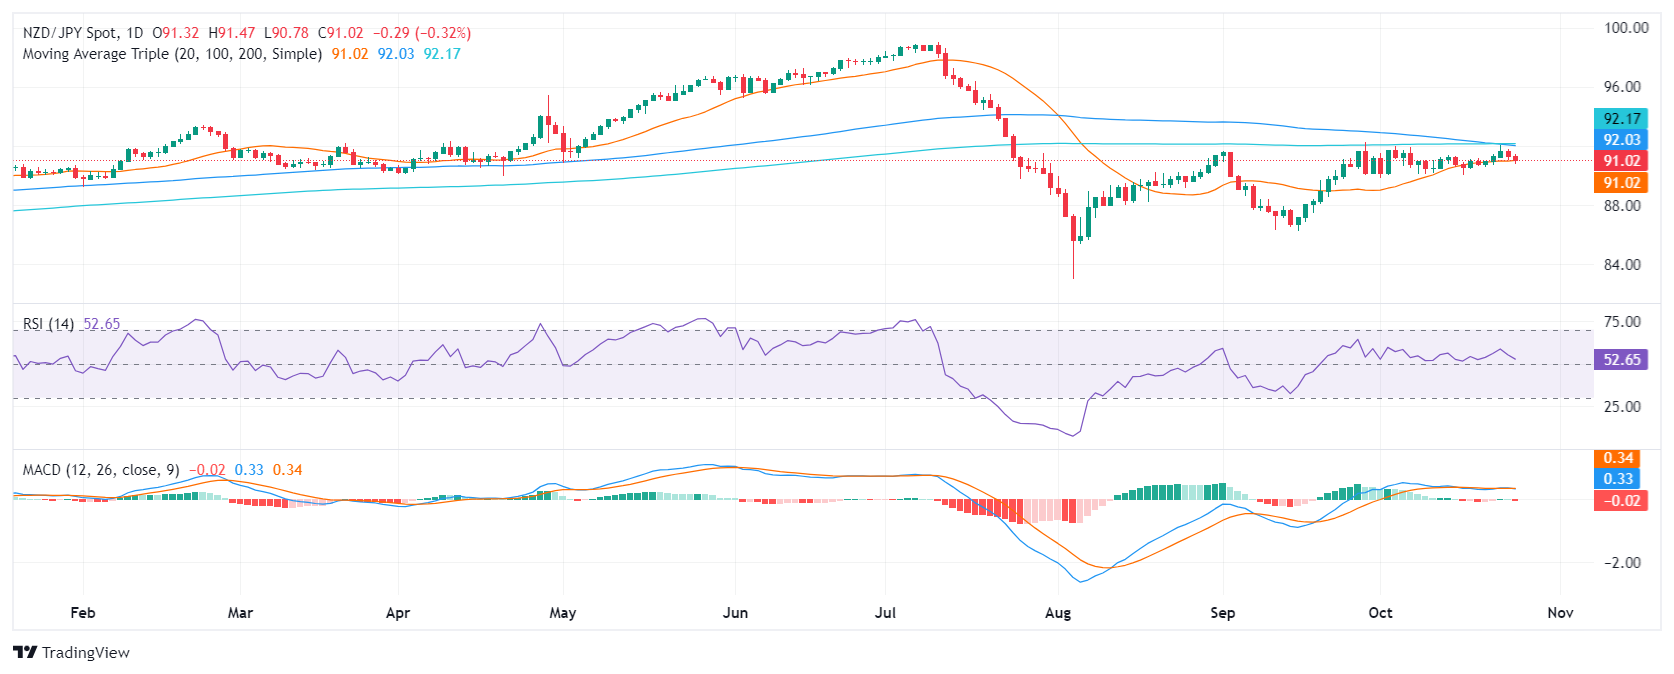
- Technical indicators suggest a growing bearish momentum, with the RSI and MACD starting to turn in favor of the sellers.
- The 100 and 200-day SMA completed a bearish crossover at 92.00.
The NZD/JPY pair has traded within a tight range recently, demonstrating a lack of clear directional momentum. However, Friday's session saw a modest decline of 0.32% to 91.00, hinting at a potential shift in sentiment.
Technical indicators align with this observation. The Relative Strength Index (RSI) of 52 suggests that buying pressure is on the wane. Meanwhile, the Moving Average Convergence Divergence (MACD) histogram is red and rising, indicating growing bearish momentum. This divergence between the price action and technical indicators suggests that selling forces may be gaining the upper hand.
It is important to note that the 100 and 200-day Simple Moving Averages (SMAs) have converged and crossed at 92.00, forming a strong resistance level. A break below this confluence could intensify selling pressure and add further downward momentum to the pair. Conversely, a break above this key level could indicate a reversal of the current trend.
NZD/JPY daily chart
Forex News
Keep up with the financial markets, know what's happening and what is affecting the markets with our latest market updates. Analyze market movers, trends and build your trading strategies accordingly.