Dow Jones Industrial Average churns charts as cool CPI inflation clashes with trade war fears
- The Dow Jones rose early on Wednesday after US CPI inflation cooled faster than expected.
- Market sentiment quickly resumed its sour stance as trade war fears continue to simmer.
- Global tariffs on steel and aluminum imports are set to punish US consumers.
The Dow Jones is churning around the midpoint on Wednesday, bearing the brunt of broad-market trade war fears as the United States (US) imposes a global 25% tariff on all steel and aluminum imports into the US market. US consumers are set to bear the brunt of the cost burden, and US officials have signaled that further import tariffs will be coming on other key commodities such as copper.
US Consumer Price Index (CPI) inflation cooled even faster than expected in February, with headline CPI inflation falling to 0.2% MoM and 2.8% YoY, declining slightly faster than markets had forecast. The coolish print, while still riding well above the Federal Reserve’s (Fed) 2% target, helped to bolster some confidence that the Fed will remain able to adjust policy rates in the future. According to the CME’s FedWatch Tool, rate markets are pricing in better-than-even odds of the Fed’s next rate cut happening in June, compared to the previous bet of July.
It has been nearly four years since headline US inflation hit “transitory” levels, and outside of a brief lull in Q3 2024, top-of-the-line inflation metrics have remained relatively unchanged from where they sat in June of 2023, when the post-Covid inflation rate initially cooled to 3% on an annualized basis.
Commodity watchers will note that within February’s cooler CPI print, the underlying basket is still flashing some possible warning signs that policymakers may need to deal with in the near future: Gasoline and fuel oil prices generally fell during the reference period, declining 3.1% and 5.1% YoY, respectively, but natural gas prices soared 6% in the aggregate. Inflation estimates for shelter prices also climbed another 4.2% YoY, while a slight 0.3% decline in new vehicle prices masked another acceleration in food price inflation, which rose 2.6% from this time a year ago.
Market bears refused to let the overall cooler CPI print dampen their selling spirits on Wednesday. The Dow Jones shrugged off an initial topside spike early in the day to resume selling off key stocks in the face of the US administration’s new global 25% import tax on all steel and aluminum into the US. Trade war concerns continue to simmer away near the foreground, with US Commerce Secretary Howard Lutnick warning markets that additional protections on copper will likely be in the works.
Dow Jones news
A little over half of the Dow Jones Industrial Average tested into the red on Wednesday, with some of the day’s losses getting offset by an upside recovery in battered tech-rally darling Nvidia (NVDA). Nvidia was up 5.6% on the day, clawing its way back to $115 per share ahead of the company’s week-long GTC AI conference.
On the low side, Verizon Communications (VZ) fell 3.3%, slipping below $42 per share. McDonald’s (MCD) also fell 2.7%, dragging the fast food giant down below $300 per share for the first time since early February.
Dow Jones price forecast
Wednesday’s back-and-forth chart action saw the Dow Jones briefly testing new 26-week lows at the 41,000 major price handle. Still, bidders remain unwilling to give up the fight entirely, marking a possible technical turnaround point at the key technical figure. The DJIA remains down around 3.5% for the current week, and intraday bids are off of last November’s record highs by over 8% as the Dow Jones inches toward correction territory.
Dow Jones daily chart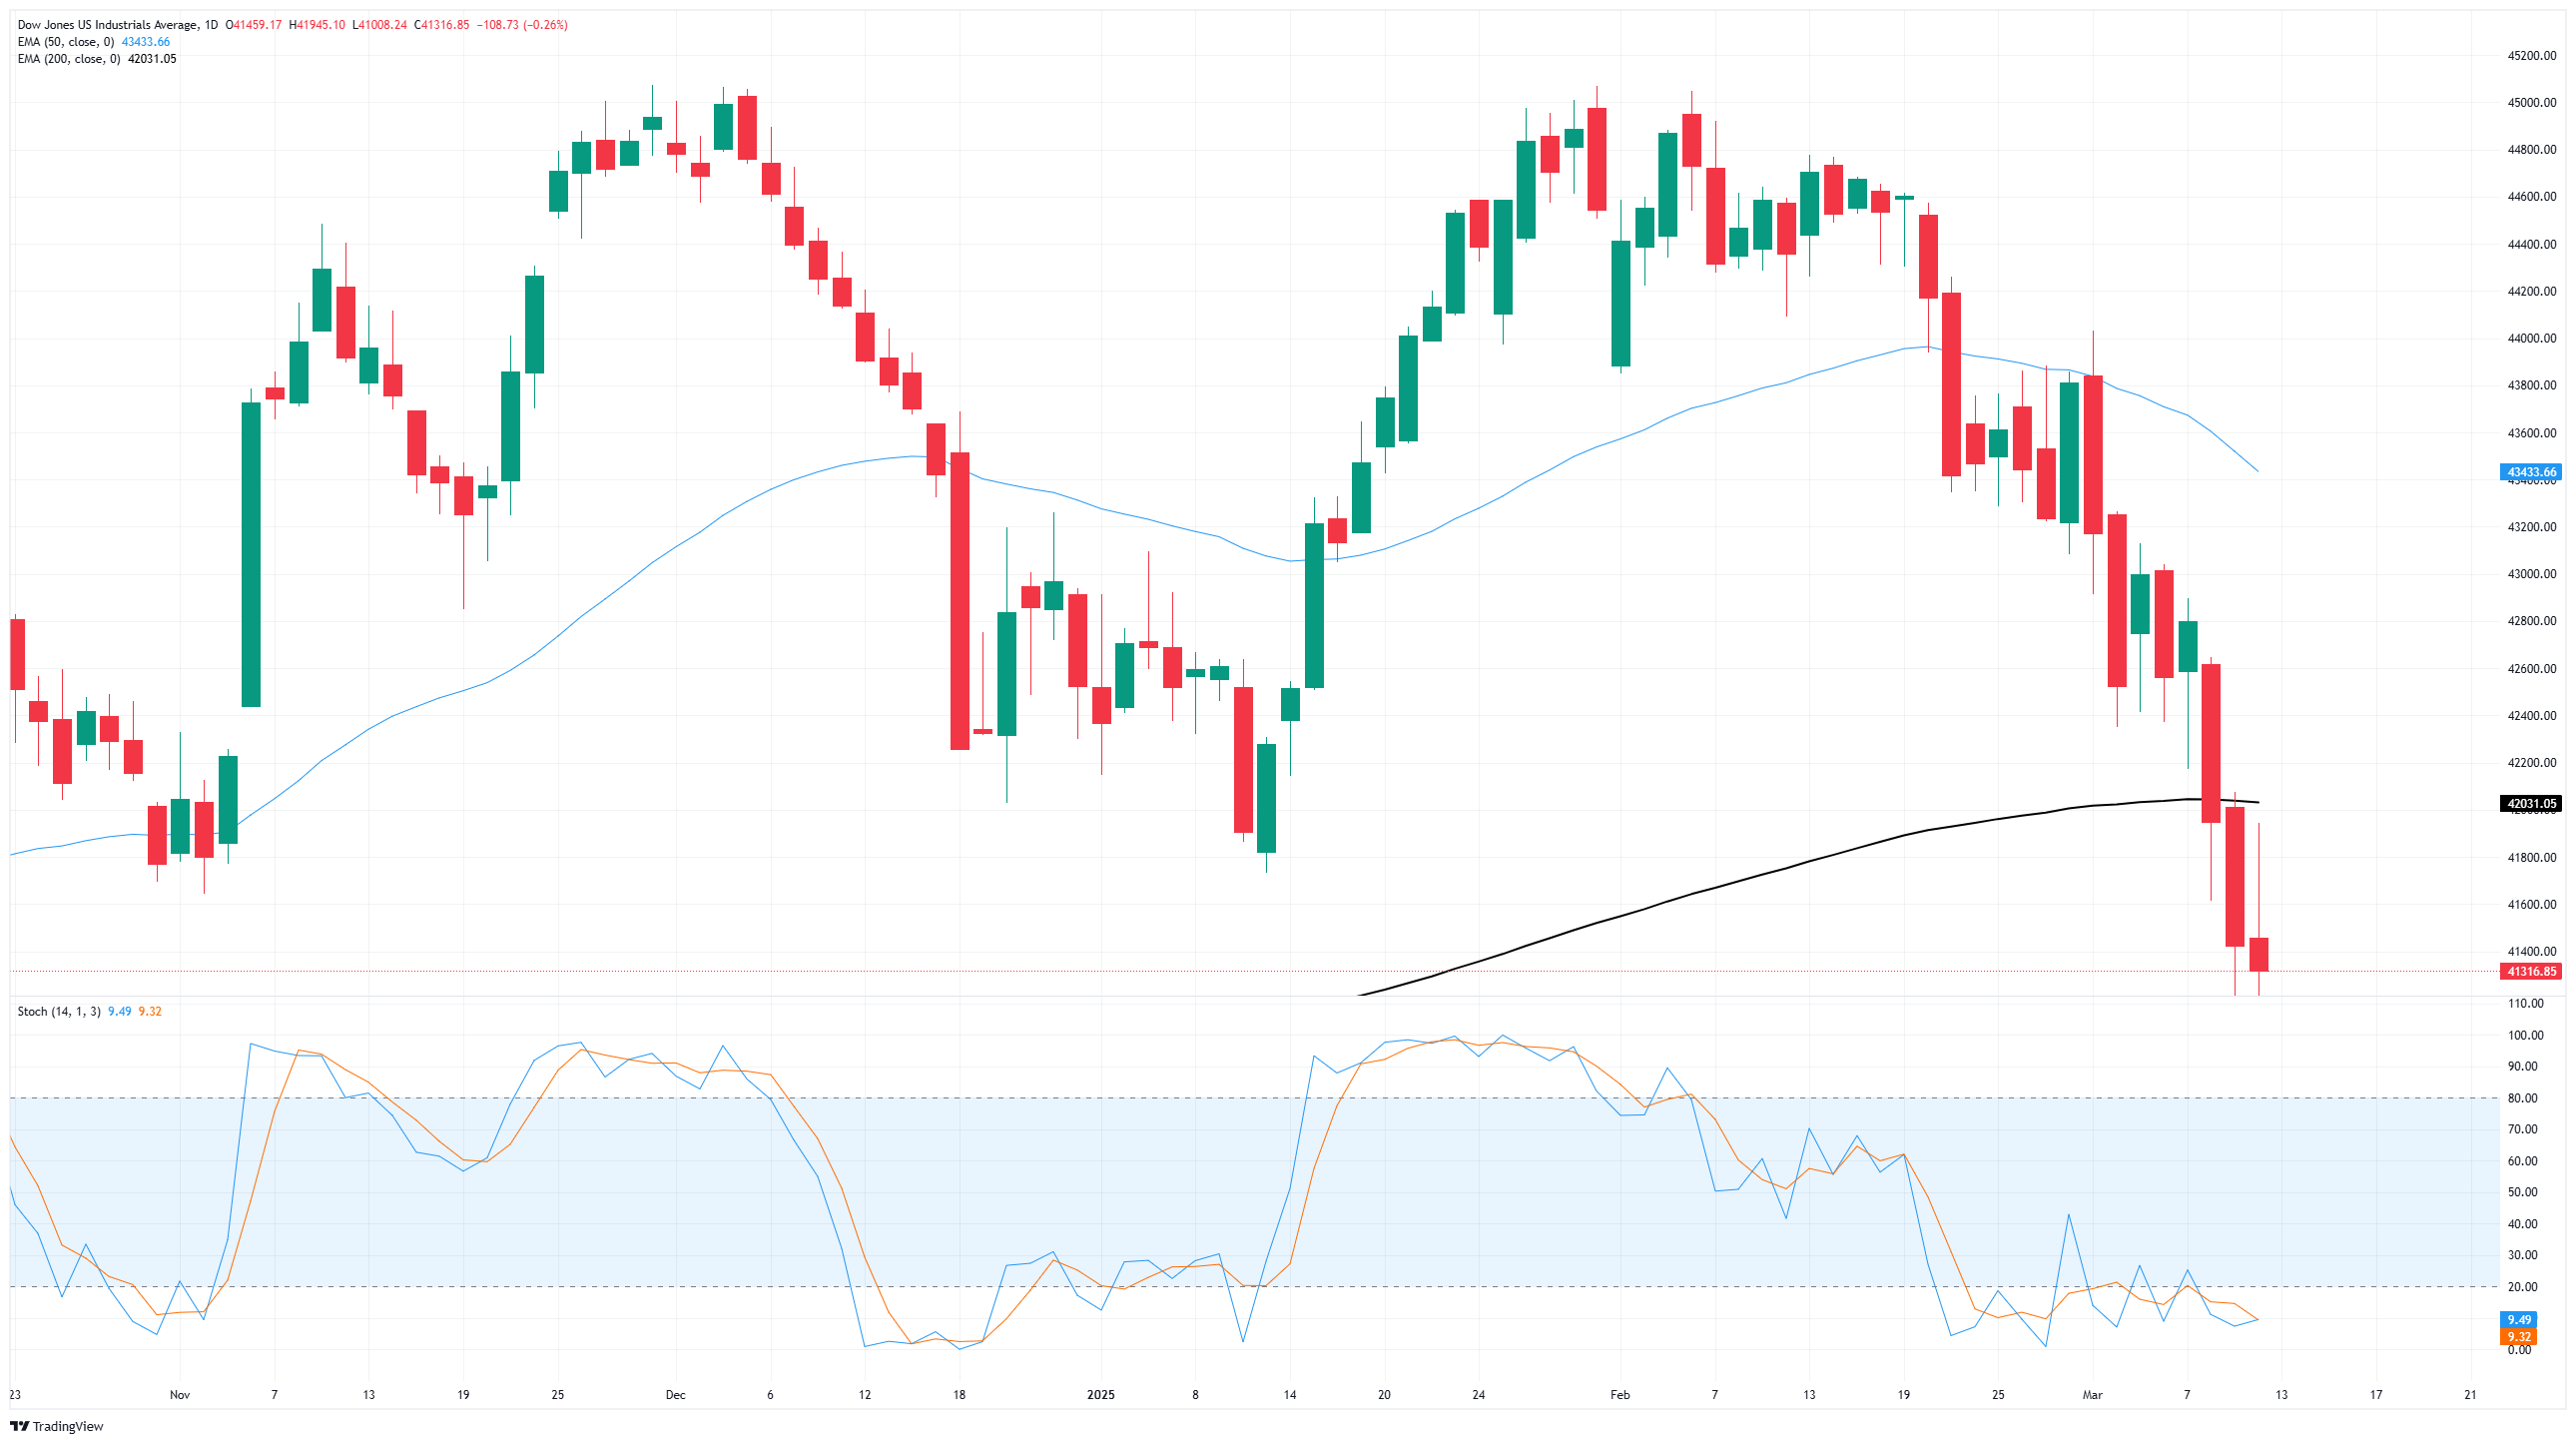
Dow Jones FAQs
The Dow Jones Industrial Average, one of the oldest stock market indices in the world, is compiled of the 30 most traded stocks in the US. The index is price-weighted rather than weighted by capitalization. It is calculated by summing the prices of the constituent stocks and dividing them by a factor, currently 0.152. The index was founded by Charles Dow, who also founded the Wall Street Journal. In later years it has been criticized for not being broadly representative enough because it only tracks 30 conglomerates, unlike broader indices such as the S&P 500.
Many different factors drive the Dow Jones Industrial Average (DJIA). The aggregate performance of the component companies revealed in quarterly company earnings reports is the main one. US and global macroeconomic data also contributes as it impacts on investor sentiment. The level of interest rates, set by the Federal Reserve (Fed), also influences the DJIA as it affects the cost of credit, on which many corporations are heavily reliant. Therefore, inflation can be a major driver as well as other metrics which impact the Fed decisions.
Dow Theory is a method for identifying the primary trend of the stock market developed by Charles Dow. A key step is to compare the direction of the Dow Jones Industrial Average (DJIA) and the Dow Jones Transportation Average (DJTA) and only follow trends where both are moving in the same direction. Volume is a confirmatory criteria. The theory uses elements of peak and trough analysis. Dow’s theory posits three trend phases: accumulation, when smart money starts buying or selling; public participation, when the wider public joins in; and distribution, when the smart money exits.
There are a number of ways to trade the DJIA. One is to use ETFs which allow investors to trade the DJIA as a single security, rather than having to buy shares in all 30 constituent companies. A leading example is the SPDR Dow Jones Industrial Average ETF (DIA). DJIA futures contracts enable traders to speculate on the future value of the index and Options provide the right, but not the obligation, to buy or sell the index at a predetermined price in the future. Mutual funds enable investors to buy a share of a diversified portfolio of DJIA stocks thus providing exposure to the overall index.
Forex News
Keep up with the financial markets, know what's happening and what is affecting the markets with our latest market updates. Analyze market movers, trends and build your trading strategies accordingly.