Gold price surges as traders digest US inflation data, trade uncertainty
- Gold climbs above $2,930 as safe-haven demand overcomes rising US yields
- Softer US CPI supports bets on Fed rate cuts, fueling Gold’s rally despite USD rebound.
- Trade war fears persist; US Treasury yields rise on concerns of renewed inflation pressure from tariffs.
- Central banks continue aggressive Gold purchases, underpinning bullish sentiment.
Gold price rises late in the North American session, unfazed by high US Treasury bond yields and a stronger US Dollar on Wednesday. At the time of writing, XAU/USD trades with gains of 0.63% and changes hands at $2,933 after a US inflation report that was softer than projected.
The US Bureau of Labor Statistics (BLS) revealed that consumer inflation in the United States (US) edged lower in February. Nevertheless, investors remain skeptical of the improvement as aggressive tariffs on US imports could trigger a second round of inflation.
February’s data increased the odds that the Federal Reserve (Fed) might cut interest rates thrice in 2025. Nevertheless, Fed officials, led by Chair Jerome Powell, had expressed that they do not look at just one month of data.
In the meantime, US Treasury yields climbed amid fears that the global trade war could push prices higher. Consequently, the US Dollar Index (DXY), which tracks the Greenback’s value against six currencies, gains 0.14% to 103.55.
On Wednesday, 25% US tariffs on steel and aluminum took effect at midnight as US President Donald Trump is battling to reduce the trade deficit by applying duties on imports.
The non-yielding metal is poised to extend its rally, even though there is progress on a truce between Ukraine and Russia.
The World Gold Council (WGC) revealed that central banks continued to purchase Gold. The People’s Bank of China (PBoC) and the National Bank of Poland (NBP) added 10 and 29 tonnes in the first two months of 2025, respectively.
Given the backdrop, Gold is set to test the $2,950 mark. Traders will eye the release of the US Producer Price Index (PPI) for February, Initial Jobless Claims and the University of Michigan (UoM) Consumer Sentiment.
Daily digest market movers: Gold price shrugs of high US yields
- The US 10-year Treasury bond yield recovers and rises three basis points to 4.314%.
- US real yields, as measured by the US 10-year Treasury Inflation-Protected Securities (TIPS) yield that correlates inversely to Gold prices, climb one basis points to 1.981%, capping non-yielding metal gains.
- The US Consumer Price Index (CPI) for February increased 2.8% YoY, slightly below the expected 2.9% and down from 3.0% in January, indicating continued moderation in inflation.
- Core CPI, which strips out volatile food and energy prices, dipped from 3.3% in January to 3.1% YoY, reinforcing signs of continued disinflation in the U.S. economy.
- The Atlanta Fed GDPNow model predicts the first quarter of 2025 at -2.4%, which would be the first negative print since the COVID-19 pandemic.
- Money market traders had priced in 71 basis points of easing in 2025, down from 77 bps a day ago, via data from Prime Market Terminal.
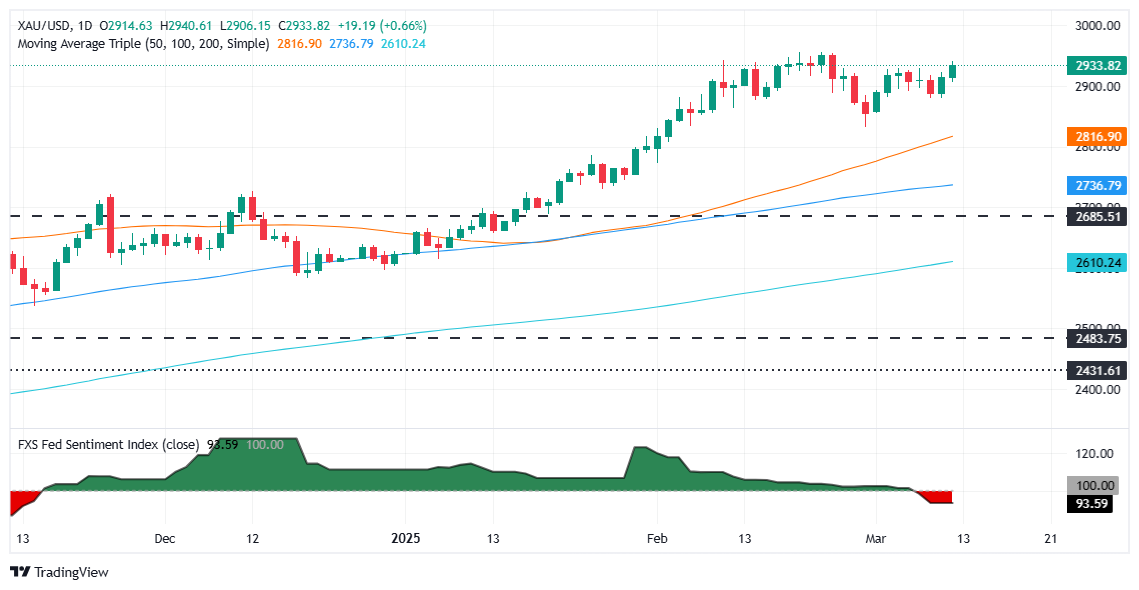
XAU/USD technical outlook: Gold prolongs its rally past $2,930
Gold price has cleared the top of the $2,880 - $2,930 trading range and hit a two-week peak of $2,940 with buyers eyeing $2,950 as the next key resistance level before clearing the record high at $2,954. Once surpassed, Gold would be poised to challenge $3,000.
Conversely, if XAU/USD drops below $2,900, the next support would be $2,850, ahead of the February 28 low of $2,832. Up next would be $2,800.
Economic Indicator
Consumer Price Index (MoM)
Inflationary or deflationary tendencies are measured by periodically summing the prices of a basket of representative goods and services and presenting the data as The Consumer Price Index (CPI). CPI data is compiled on a monthly basis and released by the US Department of Labor Statistics. The MoM figure compares the prices of goods in the reference month to the previous month.The CPI is a key indicator to measure inflation and changes in purchasing trends. Generally, a high reading is seen as bullish for the US Dollar (USD), while a low reading is seen as bearish.
Read more.Last release: Wed Mar 12, 2025 12:30
Frequency: Monthly
Actual: 0.2%
Consensus: 0.3%
Previous: 0.5%
Source: US Bureau of Labor Statistics
The US Federal Reserve has a dual mandate of maintaining price stability and maximum employment. According to such mandate, inflation should be at around 2% YoY and has become the weakest pillar of the central bank’s directive ever since the world suffered a pandemic, which extends to these days. Price pressures keep rising amid supply-chain issues and bottlenecks, with the Consumer Price Index (CPI) hanging at multi-decade highs. The Fed has already taken measures to tame inflation and is expected to maintain an aggressive stance in the foreseeable future.
Forex News
Keep up with the financial markets, know what's happening and what is affecting the markets with our latest market updates. Analyze market movers, trends and build your trading strategies accordingly.