Japanese Yen retains its positive bias amid BoJ rate hike bets, weaker USD
- The Japanese Yen snaps a two-day losing streak against the USD and recovers further from the weekly low.
- Concerns about Trump’s trade tariffs and hawkish BoJ expectations continue to act as a tailwind for the JPY.
- Fed rate cut bets keep the USD close to a multi-month low and contribute to capping the upside for USD/JPY.
The Japanese Yen (JPY) remains on the front foot against its American counterpart and keeps the USD/JPY pair depressed below the 148.00 round figure through the early European session on Thursday. Worries about the potential economic fallout from US President Donald Trump's trade tariffs, along with bets that the Bank of Japan (BoJ) will continue raising interest rates amid a broadening inflation in Japan, underpin the safe-haven JPY.
Meanwhile, hawkish BoJ expectations keep the Japanese government bond yields elevated near a multi-year top. The resultant widening of the rate differential between Japan and other countries turns out to be another factor benefiting the lower-yielding JPY. The US Dollar (USD), on the other hand, languishes near a multi-month low amid bets for more interest rate cuts by the Federal Reserve (Fed) and exerts additional pressure on the USD/JPY pair.
Japanese Yen continues to be underpinned by trade war fears and hawkish BoJ expectations
- US President Donald Trump's 25% tariff on all steel and aluminum imports took effect on Wednesday. Trump also threatened that he would respond to any countermeasures announced by the European Union and Canada.
- Trump repeated his warning to reveal "reciprocal" tariffs next month on countries around the world, fueling concerns about a further escalation of a trade war and lending support to the traditionally safe-haven Japanese Yen.
- Japanese firms agreed to significant wage hikes for the third straight year to help workers cope with inflation and address labour shortages. Higher wages are expected to boost consumer spending and contribute to rising inflation.
- This potential gives the Bank of Japan more room for additional interest rate hikes this year. This, in turn, keeps the yield on the 10-year Japanese government bond close to its highest levels since the 2008 Global Financial Crisis.
- Meanwhile, BOJ Governor Kazuo Ueda signaled that they have no immediate plans to intervene in the bond market, and said that it is natural for long-term rates to move in a way that reflects the market's outlook for the policy rate.
- Traders ramp up their bets that the Federal Reserve will have to lower interest rates this year by more than expected amid the rising possibility of an economic downturn on the back of the Trump administration’s aggressive policies.
- The expectations were reaffirmed by data released on Wednesday, which showed that the headline US Consumer Price Index (CPI) rose less than expected, by 2.8% on a yearly basis in February, down from 3% in the previous month.
- Additional details of the report revealed that the core CPI, which excludes volatile food and energy prices, eased from the 3.3% increase in January to the 3.1% YoY rate during the reported month. The reading was below the 3.2% anticipated.
- Traders now look forward to the release of the US Producer Price Index (PPI) for a fresh impetus later during the early North American session. The fundamental backdrop, however, seems tilted in favor of the USD/JPY bears.
USD/JPY could extend the intraday descent further towards testing the 147.25 support zone
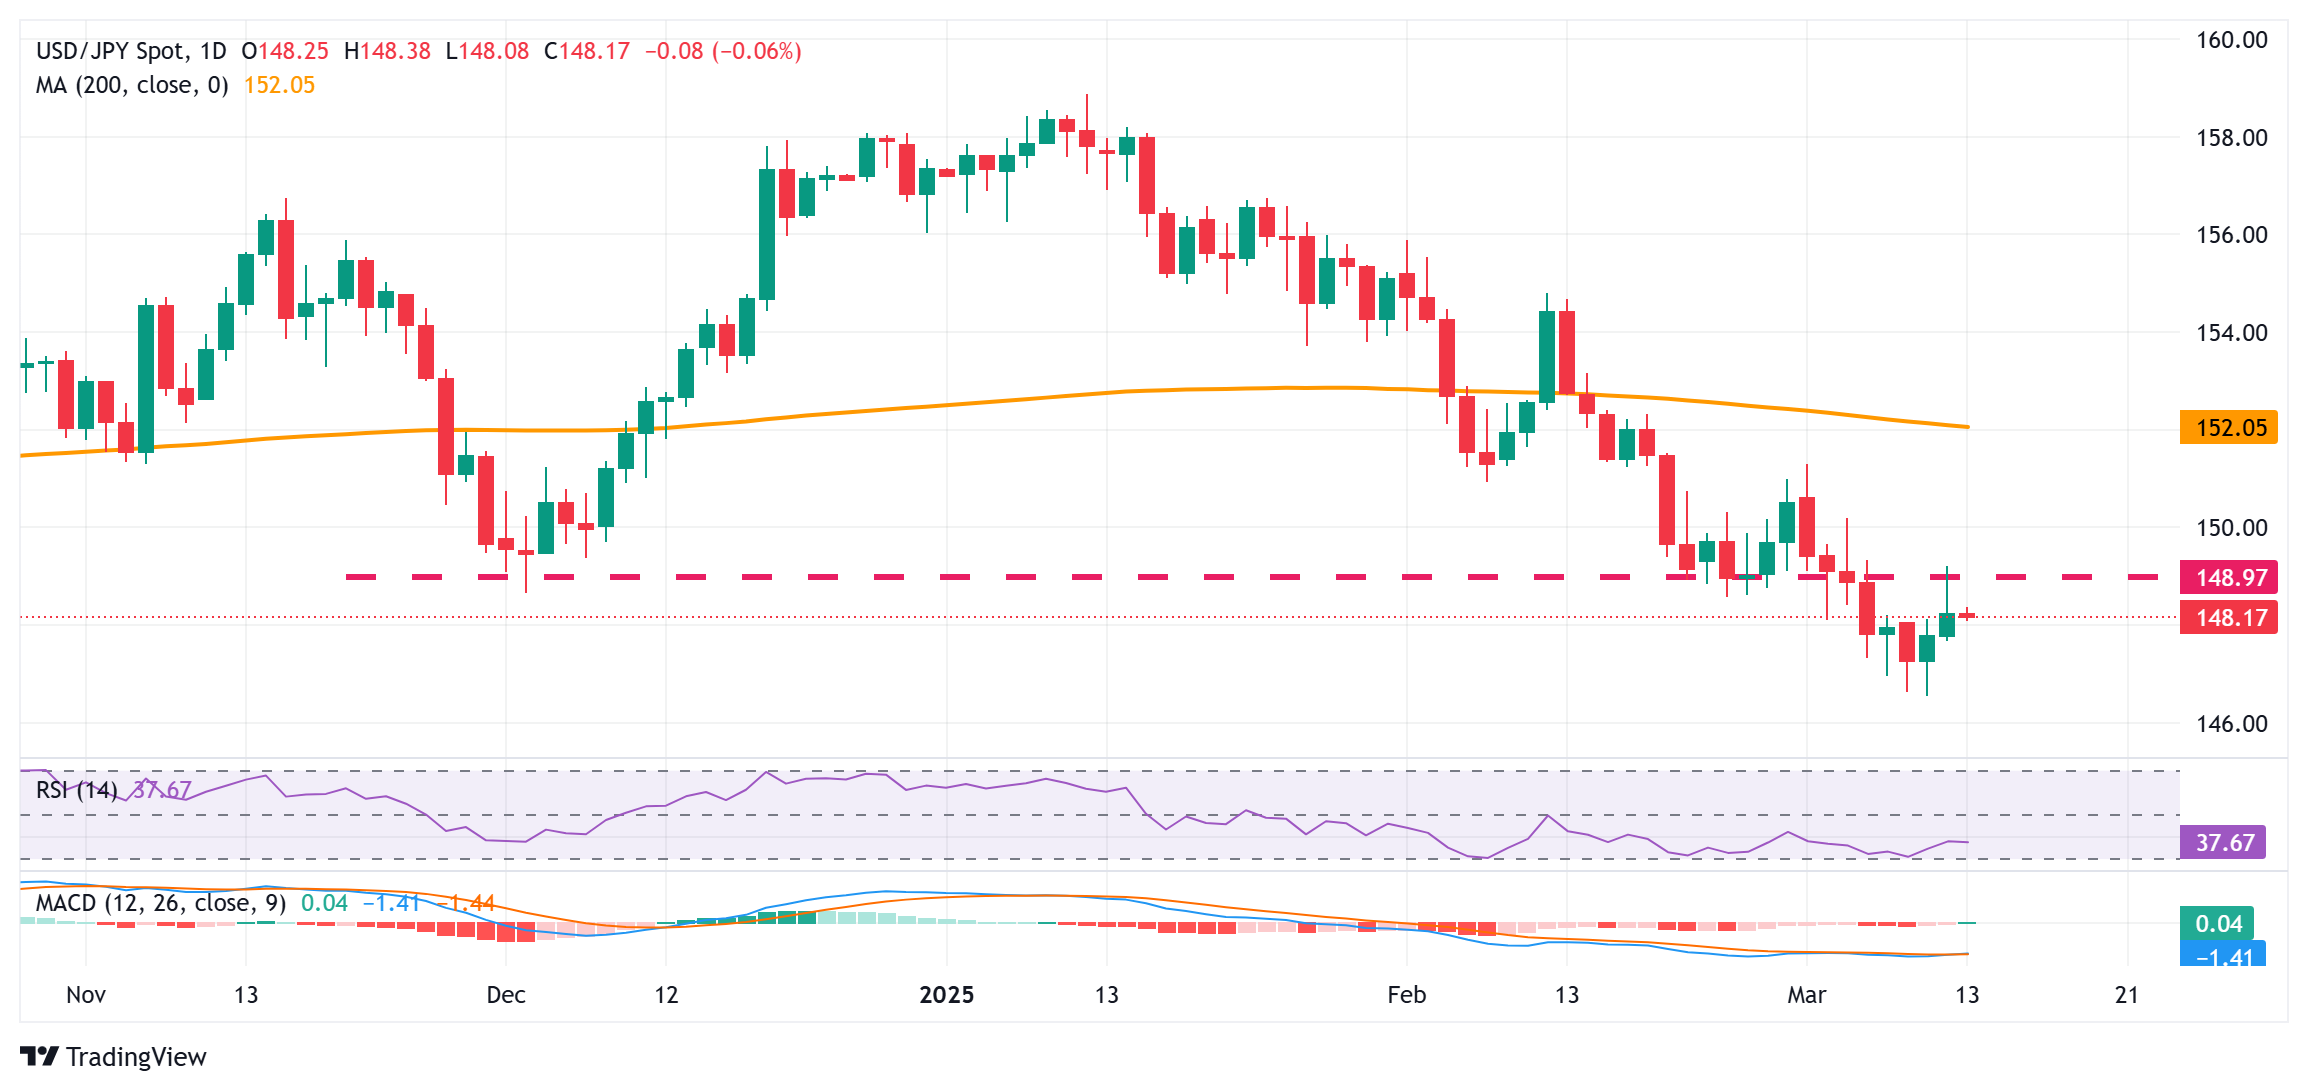
From a technical perspective, the overnight failure to find acceptance above the 149.00 round-figure mark and the subsequent pullback validate the negative outlook for the USD/JPY pair. Moreover, oscillators on the daily chart are holding deep in bearish territory and are still away from being in the oversold zone. This, in turn, suggests that the path of least resistance for spot prices remains to the downside. Hence, some follow-through selling below the 148.00 mark could expose the next relevant support near the 147.25-147.20 region before the pair slides further below the 147.00 mark, towards retesting the multi-month low, around the 146.55-146.50 area touched on Tuesday.
On the flip side, the 148.60-148.70 zone now seems to act as an immediate hurdle ahead of the 149.00 mark and the overnight swing high, around the 149.20 region. A sustained strength beyond the latter might prompt a short-covering rally and allow the USD/JPY pair to reclaim the 150.00 psychological mark. The momentum could extend further towards the 150.55-150.60 horizontal barrier en route to the 151.00 round figure and the monthly swing high, around the 151.30 area.
US Dollar PRICE This month
The table below shows the percentage change of US Dollar (USD) against listed major currencies this month. US Dollar was the strongest against the Canadian Dollar.
| USD | EUR | GBP | JPY | CAD | AUD | NZD | CHF | |
|---|---|---|---|---|---|---|---|---|
| USD | -4.34% | -2.64% | -1.30% | -0.33% | -0.97% | -1.37% | -2.04% | |
| EUR | 4.34% | 1.79% | 3.22% | 4.20% | 3.53% | 3.12% | 2.41% | |
| GBP | 2.64% | -1.79% | 1.36% | 2.37% | 1.71% | 1.31% | 0.61% | |
| JPY | 1.30% | -3.22% | -1.36% | 1.00% | 0.33% | -0.07% | -0.76% | |
| CAD | 0.33% | -4.20% | -2.37% | -1.00% | -0.65% | -1.03% | -1.72% | |
| AUD | 0.97% | -3.53% | -1.71% | -0.33% | 0.65% | -0.39% | -1.08% | |
| NZD | 1.37% | -3.12% | -1.31% | 0.07% | 1.03% | 0.39% | -0.70% | |
| CHF | 2.04% | -2.41% | -0.61% | 0.76% | 1.72% | 1.08% | 0.70% |
The heat map shows percentage changes of major currencies against each other. The base currency is picked from the left column, while the quote currency is picked from the top row. For example, if you pick the US Dollar from the left column and move along the horizontal line to the Japanese Yen, the percentage change displayed in the box will represent USD (base)/JPY (quote).
Forex News
Keep up with the financial markets, know what's happening and what is affecting the markets with our latest market updates. Analyze market movers, trends and build your trading strategies accordingly.