NZD/USD Price Forecast: Tests nine-day EMA support near 0.5700 with a consolidation phase
- NZD/USD could challenge the upper trendline of the rectangle at 0.5780, followed by the three-month high of 0.5794.
- The bearish rectangle pattern indicates a potential downward breakout after a consolidation phase.
- Immediate support is found at the nine-day EMA of 0.5705, aligned with the 50-day EMA at 0.5699.
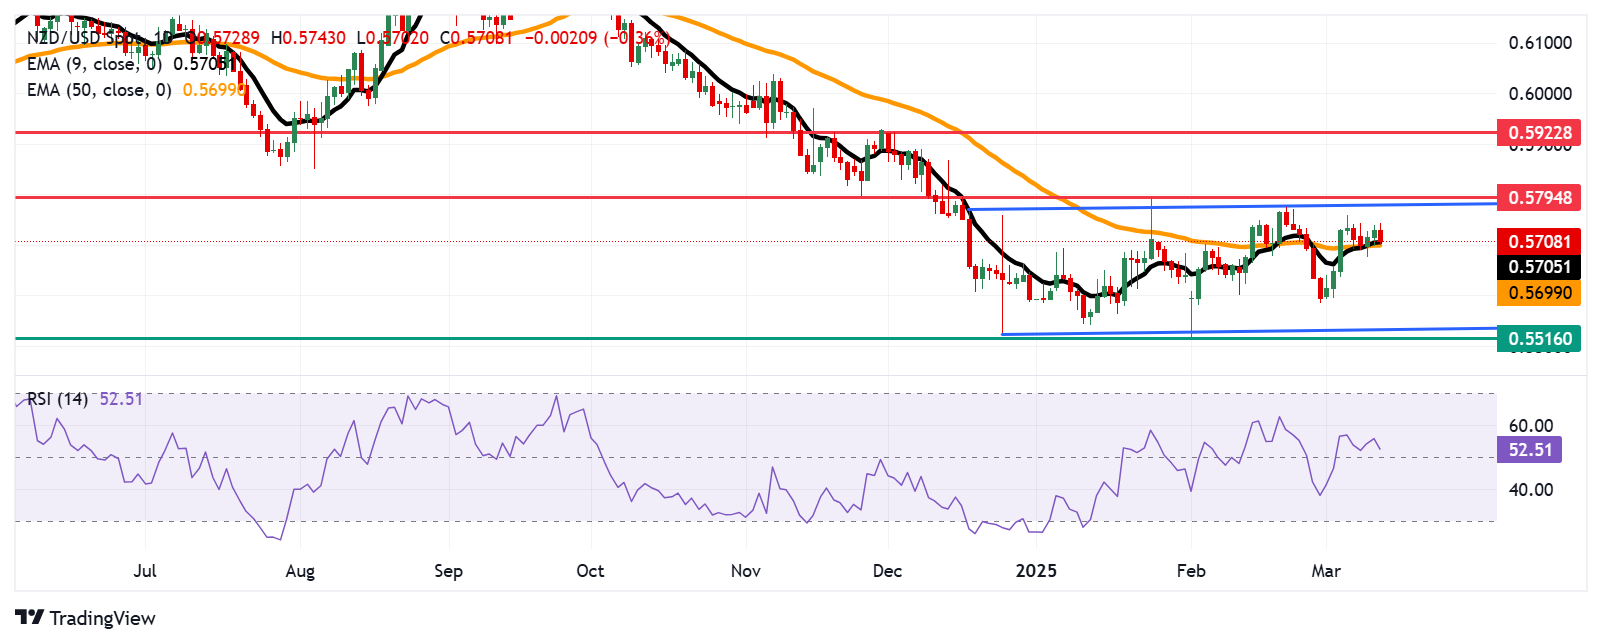
NZD/USD pulls back from its gains over the past two sessions, trading near 0.5710 during European trading hours on Thursday. Technical analysis of the daily chart suggests a potential downward breakout following a consolidation phase, as the pair moves within a bearish rectangle pattern. This formation indicates that sellers maintain control, while buyers temporarily support the price within a defined range before the next decline.
The nine-day and 50-day Exponential Moving Average (EMA) align together, signaling a period of equilibrium in the market where short-term and medium-term trends are converging. However, the 9-day EMA breaks above the 50-day EMA, signaling a bullish momentum shift. Additionally, the 14-day Relative Strength Index (RSI) remains above the 50 mark, suggesting that bullish bias is in play.
On the upside, the NZD/USD pair may test the upper trendline of the rectangle at 0.5780, followed by the three-month high of 0.5794, reached on January 24. A decisive break above this key resistance zone could strengthen bullish momentum, potentially driving the pair toward the four-month high of 0.5922, recorded in December 2024.
The immediate support is located at the nine-day EMA of 0.5705, aligned with the 50-day EMA at 0.5699. A decisive break below these levels could weaken both short- and medium-term momentum, applying downward pressure on the NZD/USD pair. This could lead to a test of the psychological support at 0.5600, followed by the lower trendline of the rectangle near 0.5516—the lowest level since October 2022, recorded on February 3.
NZD/USD: Daily Chart
New Zealand Dollar PRICE Today
The table below shows the percentage change of New Zealand Dollar (NZD) against listed major currencies today. New Zealand Dollar was the weakest against the Japanese Yen.
| USD | EUR | GBP | JPY | CAD | AUD | NZD | CHF | |
|---|---|---|---|---|---|---|---|---|
| USD | 0.10% | 0.06% | -0.31% | 0.12% | 0.43% | 0.36% | -0.10% | |
| EUR | -0.10% | -0.03% | -0.39% | 0.00% | 0.32% | 0.29% | -0.20% | |
| GBP | -0.06% | 0.03% | -0.38% | 0.04% | 0.36% | 0.32% | -0.14% | |
| JPY | 0.31% | 0.39% | 0.38% | 0.41% | 0.74% | 0.67% | 0.24% | |
| CAD | -0.12% | -0.01% | -0.04% | -0.41% | 0.33% | 0.27% | -0.19% | |
| AUD | -0.43% | -0.32% | -0.36% | -0.74% | -0.33% | -0.04% | -0.48% | |
| NZD | -0.36% | -0.29% | -0.32% | -0.67% | -0.27% | 0.04% | -0.42% | |
| CHF | 0.10% | 0.20% | 0.14% | -0.24% | 0.19% | 0.48% | 0.42% |
The heat map shows percentage changes of major currencies against each other. The base currency is picked from the left column, while the quote currency is picked from the top row. For example, if you pick the New Zealand Dollar from the left column and move along the horizontal line to the US Dollar, the percentage change displayed in the box will represent NZD (base)/USD (quote).
Forex News
Keep up with the financial markets, know what's happening and what is affecting the markets with our latest market updates. Analyze market movers, trends and build your trading strategies accordingly.