Pound Sterling flattens against US Dollar as investors gauge Trump tariffs' outcome
- The Pound Sterling trades sideways around 1.2950 against the US Dollar as investors gauge the consequences of US President Trump’s tariff policies.
- US CPI inflation cools down more than expected in February, US PPI data eyed.
- The BoE is expected to keep interest rates steady next week.
The Pound Sterling (GBP) turns sideways around 1.2950 against the US Dollar (USD) on Thursday after posting a fresh four-month high near 1.2990 the previous day. The GBP/USD pair consolidates as the US Dollar steadies after declining for two weeks, while investors weigh the consequences of United States (US) President Donald Trump’s tariff agenda over cooling inflationary pressures and US economic growth. The US Dollar Index (DXY), which tracks the Greenback’s value against six major currencies, gains slightly to near 103.65, marginally higher from an over four-month low of 103.20 reached on Tuesday.
On Wednesday, US President Trump threatened to announce retaliatory tariffs on the European Union (EU) after the 27-nation bloc warned to impose counter-tariffs on goods imported from the US worth 26 billion Euros (EUR). The shared continent vowed to impose counter-surcharges on the US as Trump’s decision to levy 25% tariffs on imports of steel and aluminum across the globe went into effect.
Fears of a potential EU-US trade war have offered a temporary cushion to the US Dollar. However, softer-than-expected US Consumer Price Index (CPI) data for February is expected to keep the upside in the Greenback limited. The US CPI report showed on Wednesday that the headline and core inflation decelerated at a faster-than-expected pace to 2.8% and 3.1%, respectively. This scenario is unfavorable for the US Dollar as cooling price pressures boost Federal Reserve (Fed) dovish bets.
For more cues on inflation, investors will focus on the US Producer Price Index (PPI) data for February, which will be published at 12:30 GMT. Economists expect the headline PPI to have risen by 3.3% year-over-year, slower than the 3.5% increase in January. In the same period, the core PPI – which excludes volatile food and energy prices – is expected to grow steadily by 3.6%.
US Dollar PRICE Today
The table below shows the percentage change of US Dollar (USD) against listed major currencies today. US Dollar was the strongest against the Australian Dollar.
| USD | EUR | GBP | JPY | CAD | AUD | NZD | CHF | |
|---|---|---|---|---|---|---|---|---|
| USD | 0.10% | 0.07% | -0.37% | 0.17% | 0.38% | 0.35% | -0.16% | |
| EUR | -0.10% | -0.03% | -0.47% | 0.06% | 0.27% | 0.27% | -0.26% | |
| GBP | -0.07% | 0.03% | -0.42% | 0.09% | 0.32% | 0.31% | -0.20% | |
| JPY | 0.37% | 0.47% | 0.42% | 0.50% | 0.74% | 0.72% | 0.24% | |
| CAD | -0.17% | -0.06% | -0.09% | -0.50% | 0.23% | 0.20% | -0.30% | |
| AUD | -0.38% | -0.27% | -0.32% | -0.74% | -0.23% | -0.00% | -0.49% | |
| NZD | -0.35% | -0.27% | -0.31% | -0.72% | -0.20% | 0.00% | -0.46% | |
| CHF | 0.16% | 0.26% | 0.20% | -0.24% | 0.30% | 0.49% | 0.46% |
The heat map shows percentage changes of major currencies against each other. The base currency is picked from the left column, while the quote currency is picked from the top row. For example, if you pick the US Dollar from the left column and move along the horizontal line to the Japanese Yen, the percentage change displayed in the box will represent USD (base)/JPY (quote).
Daily digest market movers: Pound Sterling trades cautiously as market sentiment falters
- The Pound Sterling trades with caution as Donald Trump's tariff measures have dampened the appeal of risk-sensitive assets. Market participants expect Trump’s ‘America First’ policies will lead to high inflation and a global economic slowdown. This has increased the demand for safe-haven assets.
- On the domestic front, investors await the United Kingdom's (UK) monthly Gross Domestic Product (GDP) and the factory data for January, which will be released on Friday. Investors will pay close attention to the UK GDP data as Bank of England (BoE) policymakers are worried about the economic outlook.
- In the February policy meeting, the BoE revised the GDP forecast for the year to 0.75%, lowered from the 1.5% projected in November. Also, BoE Monetary Policy Committee (MPC) member Catherine Mann favored a larger-than-usual interest rate cut of 50 basis points (bps) amid concerns over growth prospects.
- The UK economy is expected to have grown at a moderate pace of 0.1%, compared to the 0.4% economic expansion seen in December. Monthly factory data is estimated to have declined in the first month of 2025.
- Going forward, the next major trigger for the British currency will be the Bank of England’s (BoE) monetary policy decision, which will be announced next week. The BoE is expected to keep interest rates steady at 4.5% as most officials have guided a ‘gradual and cautious’ policy-easing approach. In the Feb meeting, the BoE reduced interest rates by 25 bps.
Technical Analysis: Pound Sterling trades firm above 200-day EMA
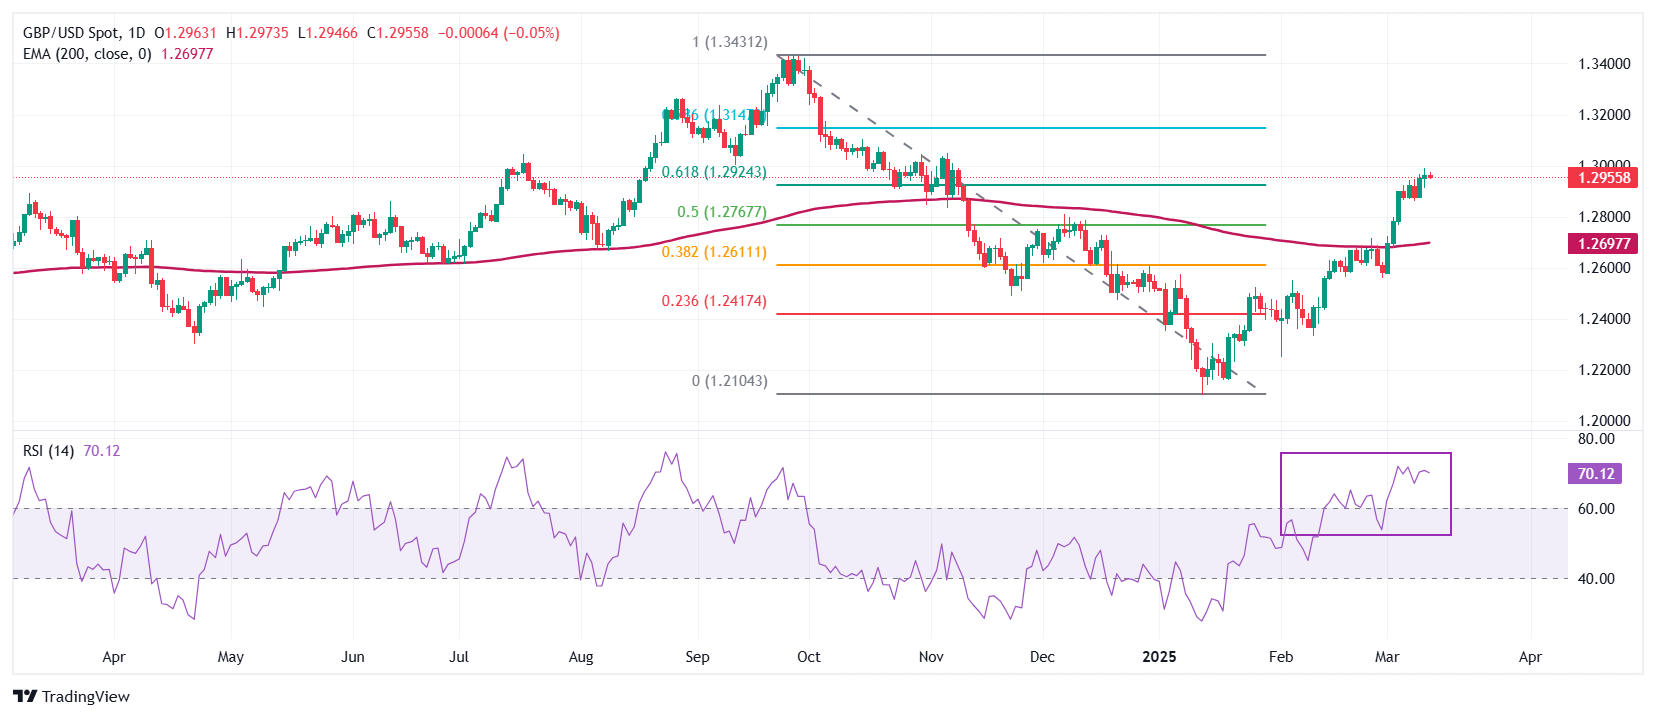
The Pound Sterling trades firmly near the four-month high around the psychological level of 1.3000 against the US Dollar on Thursday. The long-term outlook of the GBP/USD pair has turned bullish as it holds above the 200-day Exponential Moving Average (EMA), which is around 1.2697.
The 14-day Relative Strength Index (RSI) holds above 60.00, indicating a strong bullish momentum.
Looking down, the 50% Fibonacci retracement at 1.2767 and the 38.2% Fibonacci retracement at 1.2608 will act as key support zones for the pair. On the upside, the October 15 high of 1.3100 will act as a key resistance zone.
Economic Indicator
Consumer Price Index ex Food & Energy (YoY)
Inflationary or deflationary tendencies are measured by periodically summing the prices of a basket of representative goods and services and presenting the data as the Consumer Price Index (CPI). CPI data is compiled on a monthly basis and released by the US Department of Labor Statistics. The YoY reading compares the prices of goods in the reference month to the same month a year earlier. The CPI Ex Food & Energy excludes the so-called more volatile food and energy components to give a more accurate measurement of price pressures. Generally speaking, a high reading is bullish for the US Dollar (USD), while a low reading is seen as bearish.
Read more.Last release: Wed Mar 12, 2025 12:30
Frequency: Monthly
Actual: 3.1%
Consensus: 3.2%
Previous: 3.3%
Source: US Bureau of Labor Statistics
The US Federal Reserve has a dual mandate of maintaining price stability and maximum employment. According to such mandate, inflation should be at around 2% YoY and has become the weakest pillar of the central bank’s directive ever since the world suffered a pandemic, which extends to these days. Price pressures keep rising amid supply-chain issues and bottlenecks, with the Consumer Price Index (CPI) hanging at multi-decade highs. The Fed has already taken measures to tame inflation and is expected to maintain an aggressive stance in the foreseeable future.
Forex News
Keep up with the financial markets, know what's happening and what is affecting the markets with our latest market updates. Analyze market movers, trends and build your trading strategies accordingly.