Australian Dollar falls as US Dollar gains ground ahead of PPI data
- The Australian Dollar loses ground due to increased risk aversion following global trade tensions.
- Australia’s Consumer Inflation Expectations dropped to 3.6% in March, down from 4.6% in February.
- The latest US Consumer Price Index report showed that headline and core inflation cooled faster than anticipated in February.
The Australian Dollar (AUD) offers its daily gains and depreciates against the US Dollar (USD) for the third consecutive session on Thursday. However, the AUD/USD pair received support as the US Dollar remained subdued amid ongoing tariff uncertainty from US President Donald Trump and growing concerns over a potential US recession. However, the pair’s gains may be capped after Trump ruled out exempting Australia from his 25% tariffs on aluminum and steel, key exports valued at nearly $1 billion.
Australia's Consumer Inflation Expectations, consumer expectations of future inflation during the next 12 months, fell to 3.6% in March, down from 4.6% in February—the highest level since April 2024.
Prime Minister Anthony Albanese affirmed on Wednesday that “Australia will not impose reciprocal tariffs on the US,” emphasizing that retaliatory measures would only increase costs for Australian consumers and drive inflation higher.
Investors remain focused on the Reserve Bank of Australia’s (RBA) policy outlook, particularly after last week’s robust economic data lowered expectations of further rate cuts. Economic growth exceeded forecasts, marking its first acceleration in over a year.
Market participants are now awaiting Thursday’s US Producer Price Index (PPI) data and weekly jobless claims for further economic cues.
Australian Dollar faces headwinds amid rising global trade tensions
- The US Dollar Index (DXY), which tracks the US Dollar against six major currencies, is remaining steady around 103.50 at the time of writing. However, the DXY strengthened as traders digested the latest US Consumer Price Index (CPI) data, which showed both headline and core inflation cooling faster than expected in February. The softer inflation report fueled speculation that the US Federal Reserve (Fed) could cut interest rates sooner than anticipated.
- US monthly headline inflation slowed to 0.2% in February, down from 0.5% in January, while core inflation eased to 0.2%, below the expected 0.3%. On an annual basis, headline inflation declined to 2.8% from 3.0%, while core inflation fell to 3.1% from 3.3%.
- Market sentiment dampened following the European Union’s (EU) retaliatory tariffs on the United States (US). The US imposed a 25% tariff on European steel and aluminum, prompting the EU to respond with tariffs on €26 billion worth of US goods in April.
- Last week, Fed Chair Jerome Powell reassured markets that the central bank sees no immediate need to adjust monetary policy despite rising uncertainties. San Francisco Fed President Mary Daly echoed this sentiment, noting that increasing business uncertainty could dampen demand but does not justify an interest rate change.
- RBA Deputy Governor Andrew Hauser highlighted that global trade uncertainty is at a 50-year high. Hauser warned that uncertainty stemming from US President Donald Trump's tariffs could prompt businesses and households to delay planning and investment, potentially weighing on economic growth.
- Bloomberg reported on Tuesday, citing sources familiar with the matter, that trade and other negotiations between the US and China remain at a deadlock. Chinese officials state that the US has not provided clear steps regarding fentanyl measures needed for tariff relief. Meanwhile, a source familiar with White House discussions indicated that no plans are currently underway for an in-person meeting between the two leaders.
- China announced on Saturday that it will impose a 100% tariff on Canadian rapeseed oil, oil cakes, and peas, along with a 25% levy on aquatic products and pork from Canada. The move came in retaliation for tariffs introduced by Canada in October, escalating trade tensions. This marks a new front in a broader trade conflict driven by US President Donald Trump's tariff policies. The tariffs are set to take effect on March 20.
Australian Dollar maintains position above 50-day EMA near 0.6300
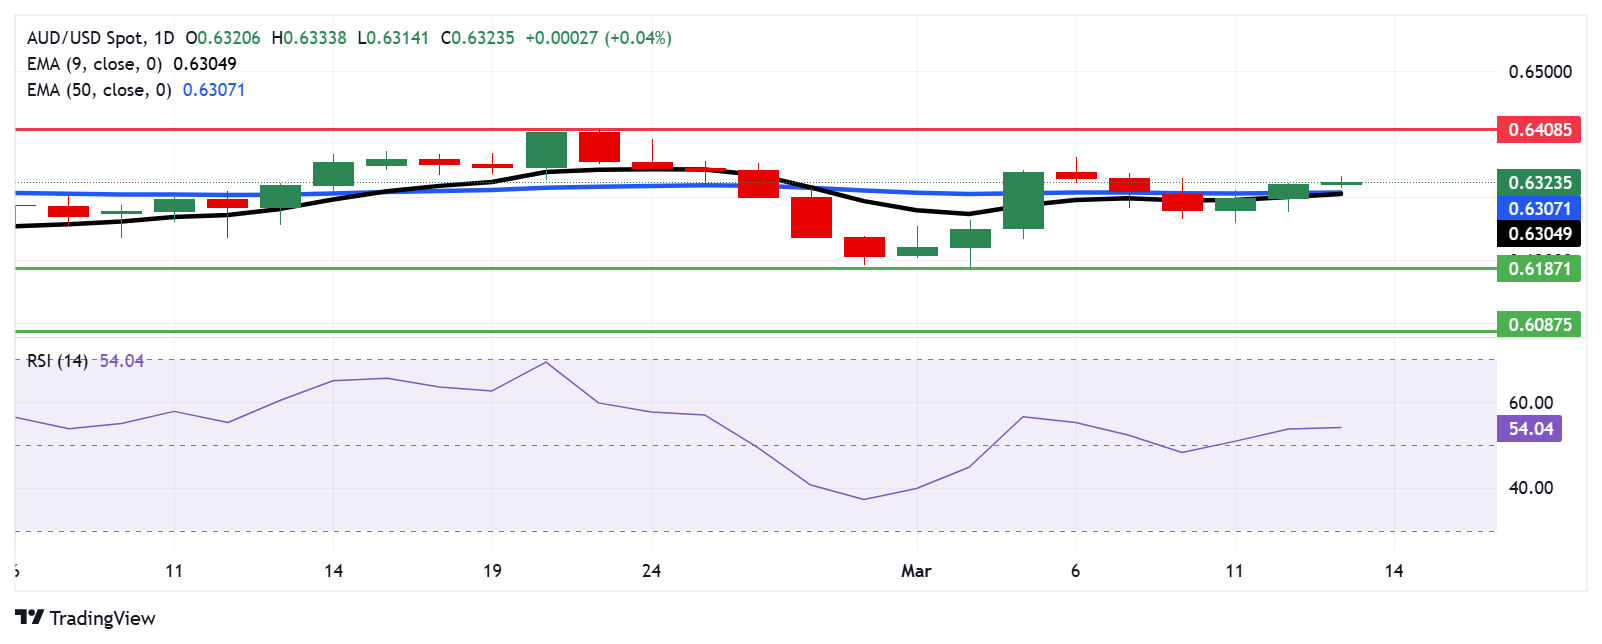
The AUD/USD pair is trading near 0.6320 on Thursday, with technical analysis of the daily chart showing the pair moving above the nine-day Exponential Moving Average (EMA), signaling strengthening short-term price momentum. Additionally, the 14-day Relative Strength Index (RSI) has moved slightly above 50, indicating a bullish bias.
On the upside, the AUD/USD pair could explore the area around the three-month high of 0.6408, last reached on February 21.
The AUD/USD pair could find immediate support at the 50-day EMA at 0.6307 level, aligned with the nine-day EMA at the 0.6304 level. A break below this level could weaken the short-term price momentum and lead the pair to navigate the region around the five-week low of 0.6187, recorded on March 5.
AUD/USD: Daily Chart
Australian Dollar PRICE Today
The table below shows the percentage change of Australian Dollar (AUD) against listed major currencies today. Australian Dollar was the weakest against the Japanese Yen.
| USD | EUR | GBP | JPY | CAD | AUD | NZD | CHF | |
|---|---|---|---|---|---|---|---|---|
| USD | 0.07% | 0.05% | -0.31% | 0.18% | 0.37% | 0.32% | -0.01% | |
| EUR | -0.07% | -0.01% | -0.37% | 0.10% | 0.30% | 0.28% | -0.08% | |
| GBP | -0.05% | 0.01% | -0.38% | 0.12% | 0.31% | 0.29% | -0.04% | |
| JPY | 0.31% | 0.37% | 0.38% | 0.46% | 0.68% | 0.64% | 0.33% | |
| CAD | -0.18% | -0.10% | -0.12% | -0.46% | 0.21% | 0.16% | -0.16% | |
| AUD | -0.37% | -0.30% | -0.31% | -0.68% | -0.21% | -0.03% | -0.33% | |
| NZD | -0.32% | -0.28% | -0.29% | -0.64% | -0.16% | 0.03% | -0.29% | |
| CHF | 0.01% | 0.08% | 0.04% | -0.33% | 0.16% | 0.33% | 0.29% |
The heat map shows percentage changes of major currencies against each other. The base currency is picked from the left column, while the quote currency is picked from the top row. For example, if you pick the Australian Dollar from the left column and move along the horizontal line to the US Dollar, the percentage change displayed in the box will represent AUD (base)/USD (quote).
Economic Indicator
Producer Price Index ex Food & Energy (YoY)
The Producer Price Index ex Food & energy released by the Bureau of Labor statistics, Department of Labor measures the average changes in prices in primary markets of the US by producers of commodities in all states of processing. Those volatile products such as food and energy are excluded in order to capture an accurate calculation. Generally speaking, a high reading is seen as positive (or bullish) for the USD, whereas a low reading is seen as negative (or bearish).
Read more.Next release: Thu Mar 13, 2025 12:30
Frequency: Monthly
Consensus: 3.6%
Previous: 3.6%
Source: US Bureau of Labor Statistics
Forex News
Keep up with the financial markets, know what's happening and what is affecting the markets with our latest market updates. Analyze market movers, trends and build your trading strategies accordingly.