Australian Dollar holds gains as US Dollar remains subdued ahead of ISM Services PMI
- The Australian Dollar experiences volatility amid Trump's Congressional speech.
- Australia's Gross Domestic Product grew by 0.6% QoQ in Q4 2024, surpassing market expectations of 0.5%.
- US Commerce Secretary Lutnick indicated that Trump may reconsider his tariff policy less than 48 hours after its implementation.
The Australian Dollar (AUD) moves sideways on Wednesday, with the AUD/USD pair gaining ground as the USD remains under pressure amid growing concerns over slowing economic growth and the impact of tariffs on the US economy. Traders await US ISM Services PMI and ADP Employment Change due later in the North American session.
The AUD remains resilient following key economic data released on Wednesday. Australia's Gross Domestic Product (GDP) expanded by 0.6% quarter-over-quarter in Q4 2024, surpassing the 0.3% growth in Q3 and exceeding market expectations of 0.5%. On an annual basis, GDP grew by 1.3% in Q4, up from 0.8% in the previous quarter.
The Judo Bank Composite Purchasing Managers’ Index (PMI) declined to 50.6 in February from 51.1 in January, marking the fifth consecutive month of growth in business activity, albeit at a slower pace. The Services PMI also eased to 50.8 from 51.2, reflecting continued expansion for the thirteenth straight month, though at a moderated rate.
China’s Services Purchasing Managers’ Index (PMI) unexpectedly rose to 51.4 in February from 51.0 in January, exceeding market expectations of 50.8.
Reserve Bank of Australia (RBA) Deputy Governor Andrew Hauser highlighted that global trade uncertainty is at a 50-year high. Hauser warned that uncertainty stemming from US President Donald Trump's tariffs could prompt businesses and households to delay planning and investment, potentially weighing on economic growth.
Australian Dollar extends gains as US Dollar continues to lose ground
- The US Dollar Index (DXY), which measures the USD against six major currencies, trades around 105.70 at the time of writing, edging higher amid rising US Treasury yields with 2- and 10-year yields on US bonds standing at 3.98% and 4.25%, respectively.
- The Greenback faced downward pressure as markets bet that President Trump will find a reason to walk back his tariff threats.
- US Commerce Secretary Howard Lutnick stated in a televised interview on Fox News that President Trump may reconsider his tariff policy less than 48 hours after its implementation. Lutnick indicated that if the USMCA rules are followed, Trump is considering offering relief. President Trump's 25% tariffs on goods from Canada and Mexico took effect on Tuesday, alongside a doubling of duties on Chinese imports to 20%.
- US ISM Manufacturing PMI came in at 50.3, slightly below the 50.5 forecast and down from January’s 50.9. In contrast, S&P Global’s final Manufacturing PMI for February surpassed expectations at 52.7, improving from its preliminary reading.
- According to Bloomberg, citing a defense official, the US has "paused" all current military aid to Ukraine. The official stated that all US military equipment not yet in Ukraine would be halted, including weapons in transit via aircraft and ships, as well as those waiting in transit areas in Poland. The pause was reportedly ordered by President Trump, with Defense Secretary Pete Hegseth directed to implement the decision. On Friday, tensions escalated between US President Donald Trump and Ukrainian leader Volodymyr Zelenskyy during peace deal negotiations.
- Chinese authorities announced early Wednesday that they are setting a target of approximately 5% economic growth for 2025, with a 2% goal for the Consumer Price Index (CPI). Additionally, China plans to implement a proactive fiscal policy while ensuring stability in both the real estate and stock markets.
- The RBA’s February Meeting Minutes highlighted downside risks to the economy. While the Board acknowledged the labor market's strength as a key reason to maintain rates, it noted that the current tightness was inconsistent with a 2.5% inflation target. Ultimately, the Board saw a stronger case for cutting rates.
- Australia’s Retail Sales, a key indicator of consumer spending, increased by 0.3% month-over-month in January, rebounding from a 0.1% decline in December. However, the ANZ-Roy Morgan Australian Consumer Confidence Index dropped to 87.7 from 89.8 in the previous week, when it had reached its highest level since May 2022.
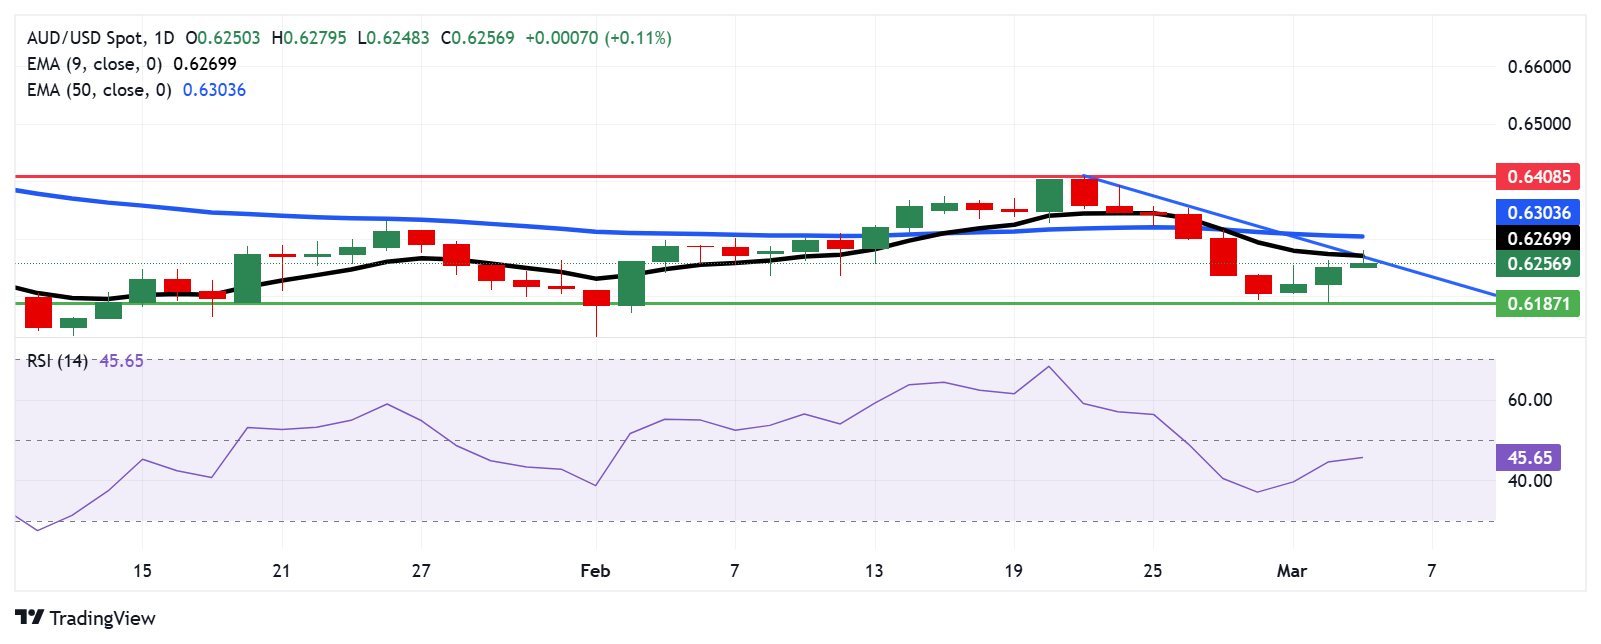
Australian Dollar rises above 0.6250; next barrier appears at nine-day EMA
AUD/USD is trading near 0.6260 on Wednesday, with technical analysis of the daily chart indicating the pair remains below the nine-day Exponential Moving Average (EMA), suggesting weakening short-term momentum. Additionally, the 14-day Relative Strength Index (RSI) stays below 50, reinforcing a bearish outlook.
On the downside, the AUD/USD pair could target the four-week low of 0.6187, recorded on March 5. A break below this level may open the door for further declines toward 0.6087, the lowest level since April 2020, recorded on February 3.
Immediate resistance is initially seen at the nine-day EMA of 0.6271, aligning with the trend line. A stronger barrier lies at the 50-day EMA of 0.6303.
AUD/USD: Daily Chart
Australian Dollar PRICE Today
The table below shows the percentage change of Australian Dollar (AUD) against listed major currencies today. Australian Dollar was the strongest against the Japanese Yen.
| USD | EUR | GBP | JPY | CAD | AUD | NZD | CHF | |
|---|---|---|---|---|---|---|---|---|
| USD | -0.08% | -0.03% | 0.46% | -0.35% | -0.04% | -0.01% | 0.24% | |
| EUR | 0.08% | 0.06% | 0.56% | -0.26% | 0.05% | 0.07% | 0.33% | |
| GBP | 0.03% | -0.06% | 0.46% | -0.31% | -0.02% | 0.01% | 0.27% | |
| JPY | -0.46% | -0.56% | -0.46% | -0.81% | -0.52% | -0.49% | -0.23% | |
| CAD | 0.35% | 0.26% | 0.31% | 0.81% | 0.30% | 0.33% | 0.59% | |
| AUD | 0.04% | -0.05% | 0.02% | 0.52% | -0.30% | 0.04% | 0.28% | |
| NZD | 0.01% | -0.07% | -0.01% | 0.49% | -0.33% | -0.04% | 0.26% | |
| CHF | -0.24% | -0.33% | -0.27% | 0.23% | -0.59% | -0.28% | -0.26% |
The heat map shows percentage changes of major currencies against each other. The base currency is picked from the left column, while the quote currency is picked from the top row. For example, if you pick the Australian Dollar from the left column and move along the horizontal line to the US Dollar, the percentage change displayed in the box will represent AUD (base)/USD (quote).
Economic Indicator
ISM Services PMI
The Institute for Supply Management (ISM) Services Purchasing Managers Index (PMI), released on a monthly basis, is a leading indicator gauging business activity in the US services sector, which makes up most of the economy. The indicator is obtained from a survey of supply executives across the US based on information they have collected within their respective organizations. Survey responses reflect the change, if any, in the current month compared to the previous month. A reading above 50 indicates that the services economy is generally expanding, a bullish sign for the US Dollar (USD). A reading below 50 signals that services sector activity is generally declining, which is seen as bearish for USD.
Read more.Next release: Wed Mar 05, 2025 15:00
Frequency: Monthly
Consensus: 52.6
Previous: 52.8
Source: Institute for Supply Management
The Institute for Supply Management’s (ISM) Services Purchasing Managers Index (PMI) reveals the current conditions in the US service sector, which has historically been a large GDP contributor. A print above 50 shows expansion in the service sector’s economic activity. Stronger-than-expected readings usually help the USD gather strength against its rivals. In addition to the headline PMI, the Employment Index and the Prices Paid Index numbers are also watched closely by investors as they provide useful insights regarding the state of the labour market and inflation.
Forex News
Keep up with the financial markets, know what's happening and what is affecting the markets with our latest market updates. Analyze market movers, trends and build your trading strategies accordingly.