EUR/USD moves higher amid risk-on mood ahead of Trump's inauguration
- EUR/USD recovers to near 1.0320 as the risk mode is on, with investors focusing on Trump’s inauguration.
- The Fed is expected to keep interest rates at their current levels by the May policy meeting.
- ECB’s Stournaras warns that higher tariffs by the US could drag Eurozone inflation below the central bank’s target.
EUR/USD rises sharply to near 1.0320 in Monday’s North American session. The major currency pair gains as the safe-haven appeal of the US Dollar (USD) diminishes ahead of United States (US) President-elect Donald Trump’s inauguration. The US Dollar Index (DXY), which tracks the Greenback’s value against six major currencies, declines to near 109.00.
The Greenback faces pressure as investors digest the assumption that Trump will declare a national emergency soon after taking office. This move would allow him to boost domestic energy production and reverse some climate change policies executed under Joe Biden’s administration, Bloomberg reported.
Also, a report from Fox News Digital shows that Trump would sign over 200 orders on his first day of office, which might include policies such as immigration controls, tax cuts, and higher import tariffs. The impact of these policies will be favorable for the US Dollar as investors expect them to boost growth and inflationary pressures in the United States (US). The scenario will allow the Federal Reserve (Fed) to keep interest rates at their current levels for longer.
According to the CME FedWatch tool, traders expect the Fed to keep borrowing rates in the current range of 4.25%-4.50% in the next three policy meetings. On the contrary, analysts at Morgan Stanley expect that the Fed can cut interest rates in March as the underlying inflation decelerated in December. Last week, the Consumer Price Index (CPI) report for December showed that core inflation – which excludes volatile food and energy prices – rose at a slower pace of 3.2% year-over-year.
US Dollar PRICE Today
The table below shows the percentage change of US Dollar (USD) against listed major currencies today. US Dollar was the strongest against the Swiss Franc.
| USD | EUR | GBP | JPY | CAD | AUD | NZD | CHF | |
|---|---|---|---|---|---|---|---|---|
| USD | -0.46% | -0.20% | 0.09% | -0.11% | -0.28% | -0.30% | 0.09% | |
| EUR | 0.46% | 0.21% | 0.45% | 0.25% | 0.25% | 0.06% | 0.43% | |
| GBP | 0.20% | -0.21% | 0.19% | 0.03% | 0.05% | -0.16% | 0.23% | |
| JPY | -0.09% | -0.45% | -0.19% | -0.20% | -0.33% | -0.50% | -0.18% | |
| CAD | 0.11% | -0.25% | -0.03% | 0.20% | -0.11% | -0.20% | 0.19% | |
| AUD | 0.28% | -0.25% | -0.05% | 0.33% | 0.11% | -0.29% | 0.12% | |
| NZD | 0.30% | -0.06% | 0.16% | 0.50% | 0.20% | 0.29% | 0.20% | |
| CHF | -0.09% | -0.43% | -0.23% | 0.18% | -0.19% | -0.12% | -0.20% |
The heat map shows percentage changes of major currencies against each other. The base currency is picked from the left column, while the quote currency is picked from the top row. For example, if you pick the US Dollar from the left column and move along the horizontal line to the Japanese Yen, the percentage change displayed in the box will represent USD (base)/JPY (quote).
Daily digest market movers: EUR/USD gains sharply ahead of Trump’s return to White House
- EUR/USD gains on risk-on profile, with investors awaiting Trump’s inauguration. However, the Euro (EUR) outlook remains uncertain as investors expect the European Central Bank (ECB) to deliver a series of interest rate cuts in coming policy meetings.
- Traders are fully pricing in an ECB’s 100 basis points (bps) interest rate reduction by mid-summer, which will come in the form of a 25 bps cut in each of the following four meetings. Dovish ECB bets have accelerated partly because of growing expectations that the Eurozone inflation will sustainably return to the central bank’s target of 2% and high uncertainty over incoming tariff policies from the US.
- Market experts are confident about further slower Eurozone inflation as they expect service inflation to slow down this year. Analysts at Capital Economics said in a report that the marginal increase in inflation in the services sector in December, to 4% from 3.9%, was driven by the transport and package holiday categories, which have a dependence on oil prices, while other sectors collectively contributed less to the overall inflation figure. The agency expects that oil prices are projected to drop based on historical patterns, which would soften the Eurozone inflation.
- Meanwhile, ECB officials are also comfortable with dovish bets. On Friday, ECB policymaker and the Governor of the Bank of Greece Yannis Stournaras said that policy should continue with a "series of rate cuts" at the next meetings. His dovish stance was based on the assumption that fresh protectionist measures imposed by the US could lead to "below-target Eurozone inflation."
Technical Analysis: EUR/USD trades sideways around 1.0300
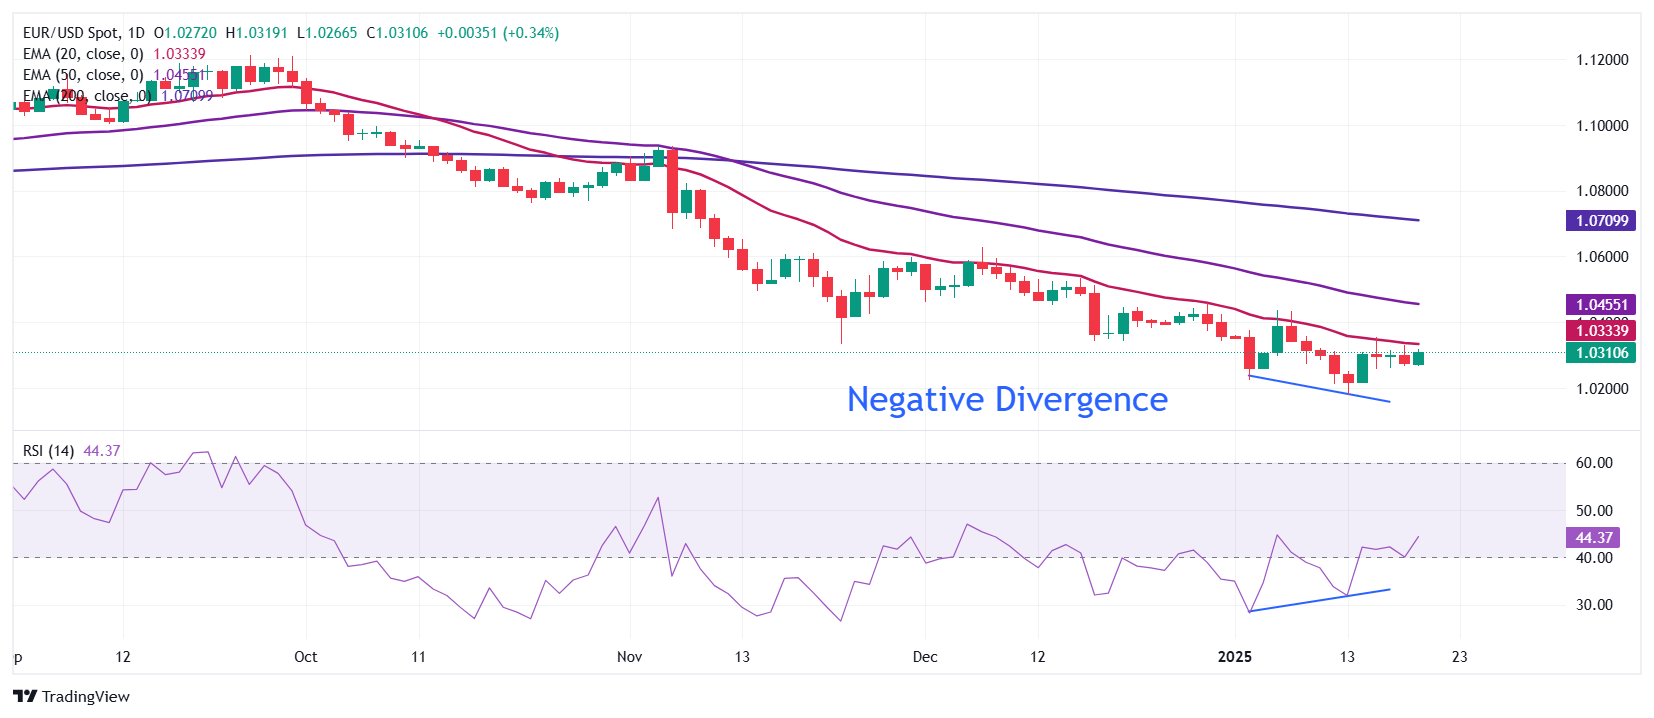
EUR/USD bounces back to near 1.0320 at the start of the week. The shared currency pair has been trading sideways around 1.0300 the last four trading days after recovering from an over two-year low of 1.0175 last week. The major currency pair rebounds amid a divergence in momentum and price action. The 14-day Relative Strength Index (RSI) formed a higher low near 35.00, while the pair made lower lows.
However, the outlook of the shared currency pair is still bearish as all short-to-long-term Exponential Moving Averages (EMAs) are sloping downwards.
Looking down, the January 13 low of 1.0175 will be the key support zone for the pair. Conversely, the January 6 high of 1.0437 will be the key barrier for the Euro bulls.
(This story was corrected on January 20 at 11:08 GMT to say that the shared currency pair has been trading sideways around 1.0300 the last four trading days after recovering from an over two-year low of 1.0175, not 1.175.)
Economic Indicator
Consumer Price Index ex Food & Energy (YoY)
Inflationary or deflationary tendencies are measured by periodically summing the prices of a basket of representative goods and services and presenting the data as the Consumer Price Index (CPI). CPI data is compiled on a monthly basis and released by the US Department of Labor Statistics. The YoY reading compares the prices of goods in the reference month to the same month a year earlier. The CPI Ex Food & Energy excludes the so-called more volatile food and energy components to give a more accurate measurement of price pressures. Generally speaking, a high reading is bullish for the US Dollar (USD), while a low reading is seen as bearish.
Read more.Last release: Wed Jan 15, 2025 13:30
Frequency: Monthly
Actual: 3.2%
Consensus: 3.3%
Previous: 3.3%
Source: US Bureau of Labor Statistics
The US Federal Reserve has a dual mandate of maintaining price stability and maximum employment. According to such mandate, inflation should be at around 2% YoY and has become the weakest pillar of the central bank’s directive ever since the world suffered a pandemic, which extends to these days. Price pressures keep rising amid supply-chain issues and bottlenecks, with the Consumer Price Index (CPI) hanging at multi-decade highs. The Fed has already taken measures to tame inflation and is expected to maintain an aggressive stance in the foreseeable future.
Forex News
Keep up with the financial markets, know what's happening and what is affecting the markets with our latest market updates. Analyze market movers, trends and build your trading strategies accordingly.
