Gold price bulls seem reluctant despite weaker USD, Trump's inaugural speech awaited
- Gold price attracts some dip-buying amid a fresh US Dollar selling, though it lacks follow-through.
- Bets that the Fed will pause its rate-cutting cycle cap gains for the XAU/USD amid the risk-on mood.
- Traders now keenly await US President-elect Donald Trump’s inaugural address for a fresh impetus.
Gold price (XAU/USD) attracts some dip-buyers near the $2,689 area on Monday, though it lacks follow-through and remains below a one-month high through the first half of the European session. A generally positive tone around the equity markets turns out to be a key factor acting as a headwind for the safe-haven precious metal amid the growing acceptance that the Federal Reserve (Fed) will pause its rate-cutting cycle later this month.
Traders also seem reluctant and opt to wait for US President-elect Donald Trump's inaugural address later today before placing directional bets amid a US bank holiday in observance of Martin Luther King Jr. Day. In the meantime, bets that the Fed will lower borrowing costs twice this year amid signs of abating inflation in the US, fail to assist the US Dollar (USD) to capitalize on Friday's gains and offer support to the non-yielding yellow metal.
Gold price lacks firm intraday direction amid mixed fundamental cues
- Gold price registered gains for the third consecutive week amid bets that the Federal Reserve may not exclude the possibility of cutting interest rates further in 2025 and benefits the Gold price.
- The expectations were lifted by the US Producer Price Index (PPI) and Consumer Price Index (CPI) released last week, which indicated that inflationary pressures in the US eased in December.
- Adding to this, Fed Governor Christopher Waller said last Thursday that inflation is likely to continue to ease and allow the US central bank to cut interest rates sooner and faster than expected.
- The US Dollar struggles to capitalize on Friday's positive move, which, along with concerns about US President-elect Donald Trump's disruptive trade tariffs, underpins the safe-haven XAU/USD.
- Against the backdrop of the Israel-Hamas ceasefire deal, hopes that Trump might relax curbs on Russia in exchange for a deal to end the Ukraine war remain supportive of the positive risk tone.
- Furthermore, the US central bank is expected to pause its rate-cutting cycle later this month amid expectations that Trump's policies could stoke inflation, capping the non-yielding yellow metal.
- Traders might also refrain from placing aggressive directional bets ahead of Trump's inaugural address later this Monday and a US holiday in observance of Martin Luther King Jr. Day.
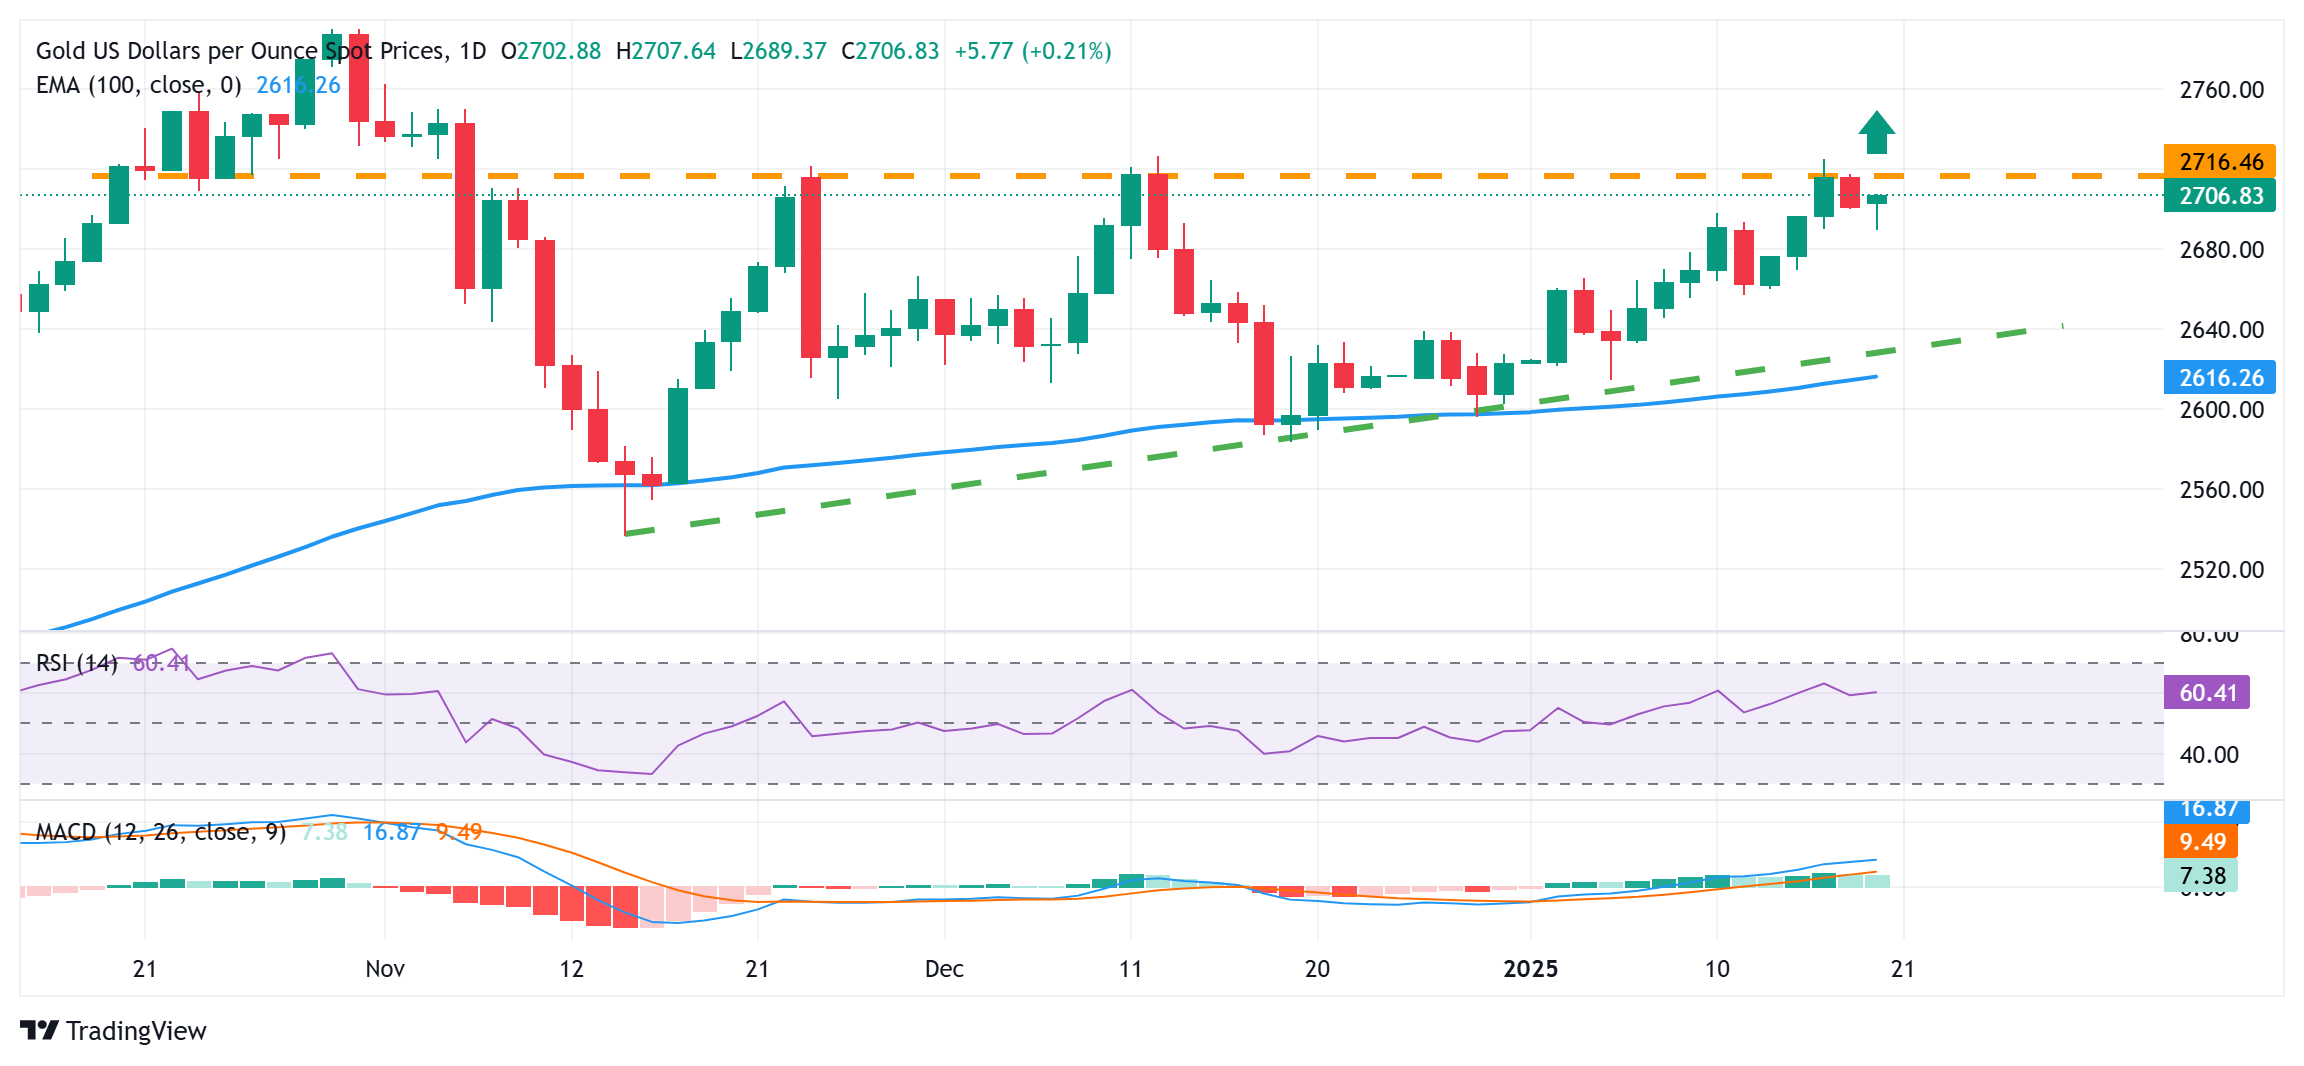
Gold price seems poised to climb beyond $2,724-2,725, or one-month top
From a technical perspective, any subsequent move up is likely to face some resistance near the $2,715 area ahead of the $2,724-2,725 region, or a one-month top touched last Thursday. Given that oscillators on the daily chart have been gaining positive traction, some follow-through buying should pave the way for a move towards the $2,745 intermediate hurdle en route to the $2,760-2,762 area. The XAU/USD might eventually aim towards challenging the all-time peak, around the $2,790 region touched in October 2024.
On the flip side, any meaningful slide below the $2,700-2,690 immediate support could be seen as a buying opportunity and remain limited near the $2,662-2,662 region. The latter should act as a pivotal point, below which the Gold price could fall to the $2,635 zone en route to the $2,620-2,615 confluence – comprising a short-term ascending trend-line extending from the November swing low and the 100-day Exponential Moving Average (EMA).
US Dollar PRICE Today
The table below shows the percentage change of US Dollar (USD) against listed major currencies today. US Dollar was the strongest against the Swiss Franc.
| USD | EUR | GBP | JPY | CAD | AUD | NZD | CHF | |
|---|---|---|---|---|---|---|---|---|
| USD | -0.35% | -0.19% | -0.05% | -0.05% | -0.31% | -0.33% | -0.03% | |
| EUR | 0.35% | 0.10% | 0.19% | 0.19% | 0.10% | -0.09% | 0.19% | |
| GBP | 0.19% | -0.10% | 0.04% | 0.08% | 0.02% | -0.19% | 0.10% | |
| JPY | 0.05% | -0.19% | -0.04% | 0.00% | -0.22% | -0.38% | -0.16% | |
| CAD | 0.05% | -0.19% | -0.08% | -0.00% | -0.19% | -0.28% | 0.00% | |
| AUD | 0.31% | -0.10% | -0.02% | 0.22% | 0.19% | -0.28% | 0.03% | |
| NZD | 0.33% | 0.09% | 0.19% | 0.38% | 0.28% | 0.28% | 0.10% | |
| CHF | 0.03% | -0.19% | -0.10% | 0.16% | -0.01% | -0.03% | -0.10% |
The heat map shows percentage changes of major currencies against each other. The base currency is picked from the left column, while the quote currency is picked from the top row. For example, if you pick the US Dollar from the left column and move along the horizontal line to the Japanese Yen, the percentage change displayed in the box will represent USD (base)/JPY (quote).
Forex News
Keep up with the financial markets, know what's happening and what is affecting the markets with our latest market updates. Analyze market movers, trends and build your trading strategies accordingly.

