GBP/USD Price Forecast: Holds position around 1.3000 within descending channel
- GBP/USD may struggle as daily chart analysis suggests a bearish bias.
- The pair could find support around the lower boundary of the descending channel at 1.2810 level.
- The immediate barrier appears around the upper boundary of the descending channel at the nine-day EMA of 1.3040 level.
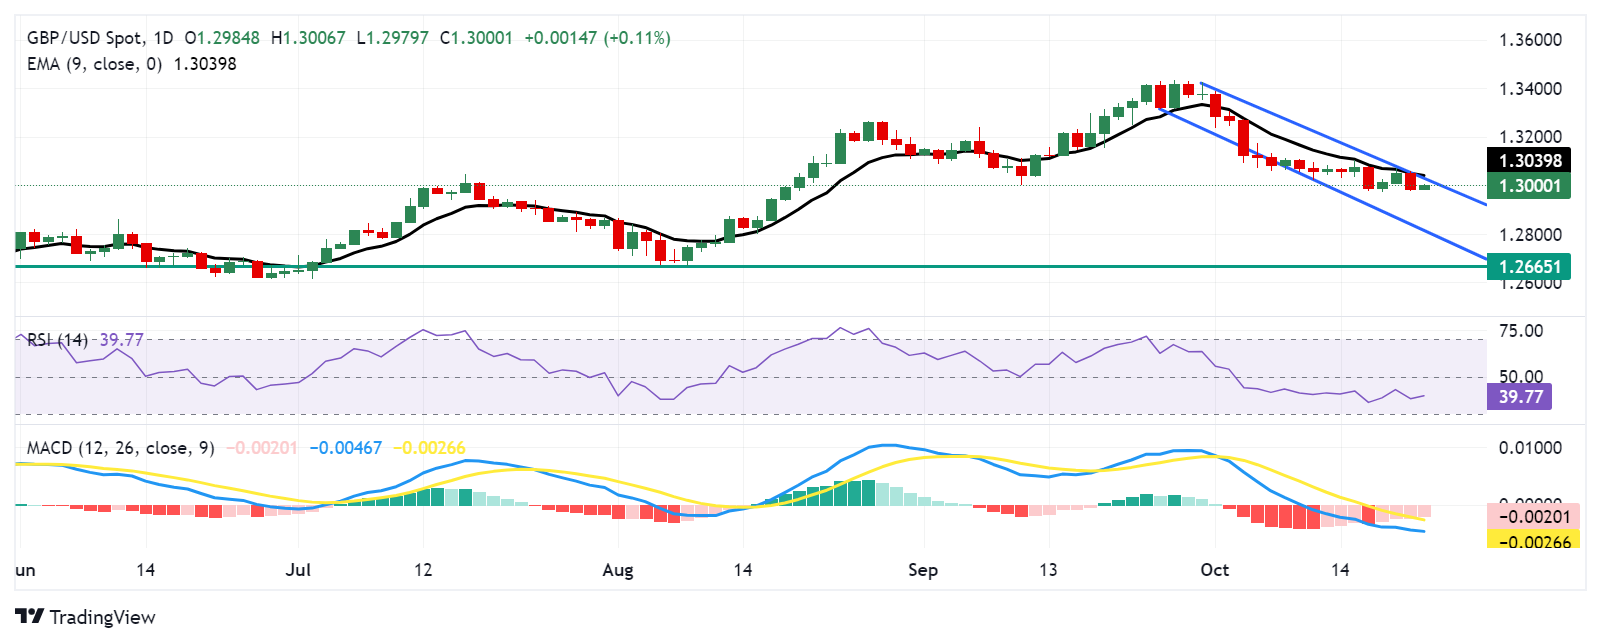
GBP/USD retraces its recent losses, trading around 1.3000 during the Asian hours on Tuesday. The daily chart analysis shows the pair is consolidating within the descending channel pattern, which suggests a bearish bias for the pair.
The Moving Average Convergence Divergence (MACD) indicator suggests bearish momentum, as the MACD line is positioned below the centreline and the signal line. Additionally, the 14-day Relative Strength Index (RSI) is below 50 level, reinforcing the ongoing bearish sentiment.
On the downside, the GBP/USD pair may navigate the area around the lower boundary of the descending channel at 1.2810, followed by the psychological level of 1.2800. A break below this level could put downward pressure on the pair to test the three-month low of 1.2665, which was recorded on August 8.
For resistance, the GBP/USD pair could test the upper boundary of the descending channel around the nine-day Exponential Moving Average (EMA) at the 1.3040 level. A break above this level could support the pair to approach the psychological level of 1.3100.
GBP/USD: Daily Chart
British Pound PRICE Today
The table below shows the percentage change of British Pound (GBP) against listed major currencies today. British Pound was the strongest against the US Dollar.
| USD | EUR | GBP | JPY | CAD | AUD | NZD | CHF | |
|---|---|---|---|---|---|---|---|---|
| USD | -0.04% | -0.10% | -0.02% | -0.01% | -0.34% | -0.34% | -0.09% | |
| EUR | 0.04% | -0.06% | 0.03% | 0.02% | -0.32% | -0.30% | -0.05% | |
| GBP | 0.10% | 0.06% | 0.10% | 0.10% | -0.25% | -0.25% | 0.02% | |
| JPY | 0.02% | -0.03% | -0.10% | -0.00% | -0.34% | -0.36% | -0.08% | |
| CAD | 0.00% | -0.02% | -0.10% | 0.00% | -0.32% | -0.34% | -0.08% | |
| AUD | 0.34% | 0.32% | 0.25% | 0.34% | 0.32% | -0.00% | 0.25% | |
| NZD | 0.34% | 0.30% | 0.25% | 0.36% | 0.34% | 0.00% | 0.27% | |
| CHF | 0.09% | 0.05% | -0.02% | 0.08% | 0.08% | -0.25% | -0.27% |
The heat map shows percentage changes of major currencies against each other. The base currency is picked from the left column, while the quote currency is picked from the top row. For example, if you pick the British Pound from the left column and move along the horizontal line to the US Dollar, the percentage change displayed in the box will represent GBP (base)/USD (quote).
Forex News
Keep up with the financial markets, know what's happening and what is affecting the markets with our latest market updates. Analyze market movers, trends and build your trading strategies accordingly.