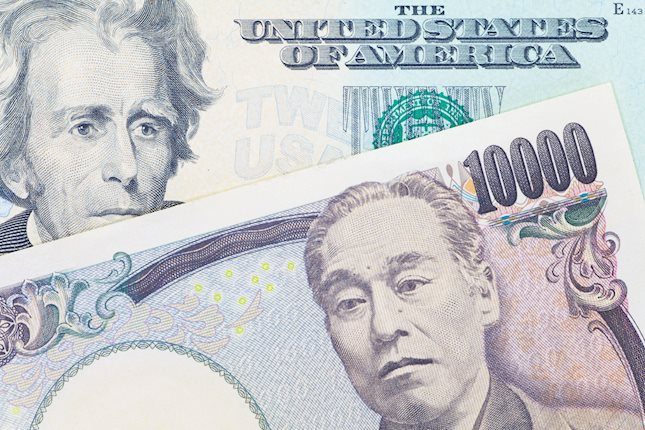
Japanese Yen weakens further below 152.00 against USD, fresh three-month low
- The Japanese Yen remains under heavy selling pressure amid the BoJ rate-hike uncertainty.
- The recent intervention warnings and the risk-off mood do little to lend support to the JPY.
- An extension of the recent USD rally pushes the USD/JPY pair to a nearly three-month high.
The Japanese Yen (JPY) continues losing ground against its American counterpart for the third straight day, lifting the USD/JPY pair beyond the 152.00 mark for the first time since late July during the Asian session. The uncertainty over the Bank of Japan’s (BoJ) ability to hike rates further this year has been a key factor behind the recent JPY downfall since the beginning of this month.
Meanwhile, the recent slump below the 150.00 psychological mark prompted some verbal intervention from Japanese officials, albeit did little to provide any respite to the JPY bulls. Even the prevalent risk-off environment and persistent geopolitical risks stemming from the ongoing conflicts in the Middle East tensions, so far, have failed to offer any support to the safe-haven JPY,
Meanwhile, bets that the Federal Reserve (Fed) will cut rates at a slower pace continue to fuel the recent upswing in the US Treasury bond yields to a three-month high and the ongoing US Dollar (USD) rally to its highest level since early August. This supports prospects for further depreciation for the lower-yielding JPY and additional gains for the USD/JPY pair.
Daily Digest Market Movers: Japanese Yen selling bias remains unabated despite intervention warnings
- The Japanese Yen touched the weakest level in almost three months against its American counterpart amid doubts over the Bank of Japan's rate-hike plans.
- The JPY bears seem unaffected by the recent verbal interventions by Japanese authorities, following a slide below the key 150.00 psychological mark.
- The prospects of slower rate cuts by the Federal Reserve and bigger fiscal deficits after the US Presidential election led to a selloff in the bond market.
- The yield on the benchmark 10-year US government bond rises to levels last seen in July and lifts the US Dollar to its highest level since early August.
- San Francisco Fed President Mary Daly noted that the economy is in a better place, inflation has fallen and the labor market has returned to a more sustainable path.
- Odds have swung in favor of former President Donald Trump winning the US election next month, fueling speculations about inflation-generating tariffs.
- As markets look for the impending strike by Israel against Iran, Hezbollah fired rockets at two bases near Tel Aviv and a naval base west of Haifa on Tuesday.
- Diplomatic efforts, so far, have failed to bring an end to the year-long conflict in the Middle East, tempering investors' appetite for perceived riskier assets.
- Traders now look to the release of the US Existing Home Sales for some impetus, though the focus remains on BoJ Governor Kazuo Ueda's speech at IMF-hosted "Governors Talk"
- The attention will then shift to the Tokyo consumer inflation on Friday, which will influence the JPY ahead of Japan's general election on October 27 and the BoJ meeting on October 31.
Technical Outlook: USD/JPY technical setup favors bullish traders, breakout above 152.00 in play
From a technical perspective, the overnight breakout above the 100-day Simple Moving Average (SMA) was seen as a fresh trigger for bullish traders. Moreover, oscillators on the daily chart are holding comfortably in positive territory and support prospects for additional gains towards the 152.00 mark. Some follow-through buying should pave the way for an extension of the recent well-established uptrend witnessed over the past month or so.
That said, the Relative Strength Index (RSI) on the daily chart has moved on the verge of breaking into overbought territory and warrants some caution for aggressive bullish traders. Hence, it will be prudent to wait for some near-term consolidation or a modest pullback before positioning for any further appreciation.
On the flip side, any meaningful corrective slide now seems to find some support near the 151.20-151.15 region ahead of the 151.00 mark. A further decline could be seen as a buying opportunity, which, in turn, should help limit the downside for the USD/JPY pair near the 150.60 area. The latter should act as a key pivotal point, below which spot prices could accelerate the fall towards the 150.00 psychological mark.
US Dollar PRICE This month
The table below shows the percentage change of US Dollar (USD) against listed major currencies this month. US Dollar was the strongest against the Japanese Yen.
| USD | EUR | GBP | JPY | CAD | AUD | NZD | CHF | |
|---|---|---|---|---|---|---|---|---|
| USD | 3.06% | 2.96% | 5.97% | 2.19% | 3.53% | 5.15% | 2.58% | |
| EUR | -3.06% | -0.10% | 2.83% | -0.85% | 0.46% | 2.02% | -0.48% | |
| GBP | -2.96% | 0.10% | 2.95% | -0.75% | 0.55% | 2.13% | -0.36% | |
| JPY | -5.97% | -2.83% | -2.95% | -3.57% | -2.30% | -0.78% | -3.19% | |
| CAD | -2.19% | 0.85% | 0.75% | 3.57% | 1.32% | 2.90% | 0.39% | |
| AUD | -3.53% | -0.46% | -0.55% | 2.30% | -1.32% | 1.56% | -0.93% | |
| NZD | -5.15% | -2.02% | -2.13% | 0.78% | -2.90% | -1.56% | -2.43% | |
| CHF | -2.58% | 0.48% | 0.36% | 3.19% | -0.39% | 0.93% | 2.43% |
The heat map shows percentage changes of major currencies against each other. The base currency is picked from the left column, while the quote currency is picked from the top row. For example, if you pick the US Dollar from the left column and move along the horizontal line to the Japanese Yen, the percentage change displayed in the box will represent USD (base)/JPY (quote).
Forex News
Keep up with the financial markets, know what's happening and what is affecting the markets with our latest market updates. Analyze market movers, trends and build your trading strategies accordingly.