Australian Dollar remains subdued due to solid US Dollar amid increased risk aversion
- The Australian Dollar moves sideways as the US Dollar appreciates amid increased risk aversion.
- The Aussie Dollar may appreciate as the RBA is widely expected to continue its hawkish monetary policy.
- The US Dollar receives support from rising odds of a nominal rate cut by the Fed in November.
The Australian Dollar (AUD) grapples to secure its previous session's gains on Wednesday. However, the AUD/USD pair faced pressure as the US Dollar (USD) strengthened with rising Treasury yields. Market risk aversion has increased due to the growing likelihood of Donald Trump winning the presidency, adding to the selling pressure on US Treasury bonds.
The downside for the AUD could be restrained due to hawkish sentiment around the Reserve Bank of Australia (RBA), bolstered by the positive employment data. Further support for the Aussie Dollar came from China's recent rate cuts, as China remains Australia's largest trading partner.
The US Dollar gains ground as recent signs of economic resilience and concerns about a potential resurgence of inflation have diminished the chances of a significant rate cut by the Federal Reserve in November.
According to the CME FedWatch Tool, there is a 91% probability of a 25-basis-point rate cut, with no expectation of a larger 50-basis-point cut.
Daily Digest Market Movers: Australian Dollar loses ground due to increased risk aversion
- 2-year and 10-year yields on US Treasury bonds stand at 4.04% and 4.21%, respectively, at the time of writing.
- On Monday, Federal Reserve Bank of Minneapolis President Neel Kashkari highlighted that the Fed is closely monitoring the US labor market for signs of rapid destabilization. Kashkari cautioned investors to anticipate a gradual pace of rate cuts over the coming quarters, suggesting that any monetary easing will likely be moderate rather than aggressive.
- San Francisco Fed President Mary Daly supported further easing, stating she sees no reason to stop lowering rates. In contrast, Kansas City Fed President Jeffrey Schmid adopted a more cautious approach, favoring restraint in large rate cuts and emphasizing that the labor market is undergoing normalization rather than showing signs of deterioration.
- On Monday, RBA Deputy Governor Andrew Hauser addressed the CBA 2024 Global Markets Conference in Sydney, expressing slight surprise at the strength of employment growth. Hauser noted that the labor participation rate is remarkably high and emphasized that while the RBA is data-dependent, it is not data-obsessed.
- The People's Bank of China (PBoC) reduced the 1-year Loan Prime Rate (LPR) to 3.10% from 3.35% and the 5-year LPR to 3.60% from 3.85%, in line with expectations. Lower borrowing costs are anticipated to stimulate China's domestic economic activity, potentially increasing demand for Australian exports.
- National Australia Bank revised its projection for the Reserve Bank of Australia (RBA) in a note last week. "We have brought forward our expectations for the timing of rate cuts, now anticipating the first cut in February 2025, instead of May," the bank stated. They continue to foresee gradual cuts, with rates expected to decrease to 3.10% by early 2026.
Technical Analysis: Australian Dollar falls toward 0.6650, six-week lows
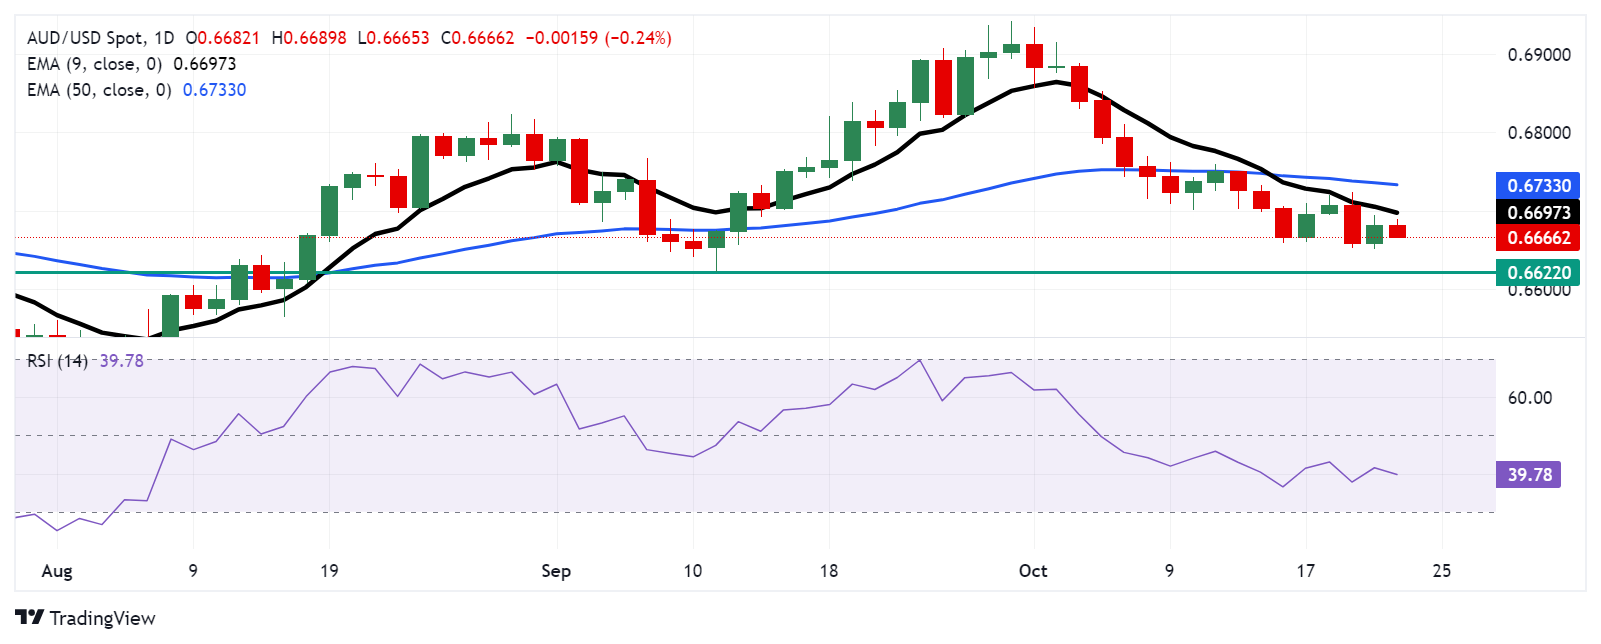
The AUD/USD pair trades around 0.6670 on Wednesday, with technical analysis of the daily chart pointing to a short-term bearish outlook as the pair remains below the nine-day Exponential Moving Average (EMA). Additionally, the 14-day Relative Strength Index (RSI) is below 50, further supporting the bearish sentiment.
On the downside, the AUD/USD pair could test its six-week low of 0.6622, last seen on September 11. The next key support is at the psychological level of 0.6600.
Resistance is expected at the nine-day EMA at 0.6698, followed by the 50-day EMA at 0.6733. A break above these levels could pave the way for a move toward the psychological resistance of 0.6800.
AUD/USD: Daily Chart
Australian Dollar PRICE Today
The table below shows the percentage change of Australian Dollar (AUD) against listed major currencies today. Australian Dollar was the weakest against the Euro.
| USD | EUR | GBP | JPY | CAD | AUD | NZD | CHF | |
|---|---|---|---|---|---|---|---|---|
| USD | 0.00% | -0.00% | 0.46% | 0.01% | 0.00% | -0.02% | 0.08% | |
| EUR | 0.00% | 0.02% | 0.48% | 0.04% | 0.03% | 0.02% | 0.11% | |
| GBP | 0.00% | -0.02% | 0.45% | -0.00% | 0.02% | -0.02% | 0.14% | |
| JPY | -0.46% | -0.48% | -0.45% | -0.45% | -0.46% | -0.48% | -0.32% | |
| CAD | -0.01% | -0.04% | 0.00% | 0.45% | -0.00% | -0.01% | 0.14% | |
| AUD | -0.01% | -0.03% | -0.02% | 0.46% | 0.00% | -0.01% | 0.14% | |
| NZD | 0.02% | -0.02% | 0.02% | 0.48% | 0.01% | 0.00% | 0.15% | |
| CHF | -0.08% | -0.11% | -0.14% | 0.32% | -0.14% | -0.14% | -0.15% |
The heat map shows percentage changes of major currencies against each other. The base currency is picked from the left column, while the quote currency is picked from the top row. For example, if you pick the Australian Dollar from the left column and move along the horizontal line to the US Dollar, the percentage change displayed in the box will represent AUD (base)/USD (quote).
Forex News
Keep up with the financial markets, know what's happening and what is affecting the markets with our latest market updates. Analyze market movers, trends and build your trading strategies accordingly.