EUR/USD strengthens as investors digest Trump's tariff plan for its neighbours
- EUR/USD advances to near 1.0500 as investors ignore renewed Trump's tariff fears.
- US President Trump confirms that the plan of imposing 25% tariffs on Canada and Mexico is still on.
- The leader of CDU, Frederich Merz, is unlikely to join hands with Far-Right.
EUR/USD rebounds to near 1.0500 in North American trading hours on Tuesday. The major currency pair gains as the US Dollar (USD) declines despite renewed fears of a global trade war. The US Dollar Index (DXY), which tracks the Greenback's value against six major currencies, declines to near 106.45.
On Monday, United States (US) President Donald Trump said that his plans of imposing 25% tariffs on Canada and Mexico on March 4, which were delayed by a month after both nations agreed to tighten border activities, are still on. “The tariffs are going forward on time, on schedule,” Trump said from the White House. Renewed fears of tariffs by Donald Trump on his North American partners had resulted in some stability in the US Dollar. The USD Index recovered from its 11-week low of 106.10 to near 106.70.
On the economic front, US Durable Goods Orders and the Personal Consumption Expenditures Price Index (PCE) data for January will be the next major trigger for the US Dollar, which will be released on Thursday and Friday, respectively. Investors will pay close attention to the PCE inflation data, which is the Federal Reserve’s (Fed) preferred inflation gauge, as some officials have shown concerns over the stalling disinflation trend lately.
In Tuesday’s session, investors will focus on the US Consumer Confidence data for February, which will be released at 15:00 GMT.
US Dollar PRICE Today
The table below shows the percentage change of US Dollar (USD) against listed major currencies today. US Dollar was the strongest against the New Zealand Dollar.
| USD | EUR | GBP | JPY | CAD | AUD | NZD | CHF | |
|---|---|---|---|---|---|---|---|---|
| USD | -0.34% | -0.32% | -0.27% | -0.05% | 0.09% | 0.15% | -0.40% | |
| EUR | 0.34% | 0.02% | 0.08% | 0.28% | 0.44% | 0.50% | -0.06% | |
| GBP | 0.32% | -0.02% | 0.06% | 0.26% | 0.41% | 0.48% | -0.08% | |
| JPY | 0.27% | -0.08% | -0.06% | 0.22% | 0.37% | 0.41% | -0.13% | |
| CAD | 0.05% | -0.28% | -0.26% | -0.22% | 0.15% | 0.21% | -0.35% | |
| AUD | -0.09% | -0.44% | -0.41% | -0.37% | -0.15% | 0.06% | -0.49% | |
| NZD | -0.15% | -0.50% | -0.48% | -0.41% | -0.21% | -0.06% | -0.56% | |
| CHF | 0.40% | 0.06% | 0.08% | 0.13% | 0.35% | 0.49% | 0.56% |
The heat map shows percentage changes of major currencies against each other. The base currency is picked from the left column, while the quote currency is picked from the top row. For example, if you pick the US Dollar from the left column and move along the horizontal line to the Japanese Yen, the percentage change displayed in the box will represent USD (base)/JPY (quote).
Daily digest market movers: EUR/USD strengthens as Euro rises
- EUR/USD rises as the Euro (EUR) strengthens against its peers despite uncertainty about the outcome of the victorious Frederich Merz-led-conservatives’ negotiations with other parties to form a coalition government.
- The leader of the Christian Democratic Union of Germany (CDU) Frederich Merz – likely the next German Chancellor – is expected to face heated negotiations to fulfill his economic agenda of loosening the ‘debt brake’ rule to increase the limit of the budget deficit, which is currently 0.35% of the Gross Domestic Product (GDP). The most likely scenario is Conservatives forming a coalition government with the Social Democratic Party (SPD) of current Chancellor Olaf Scholz. Merz is unlikely to invite Alice Weidel’s Alliance for Germany (AFD), also known as Far-Right, to form a government.
- Market participants doubt that Frederich Merz will uplift the fractured German economy as a coalition government historically results in an obstructive parliament across the globe. This led to investors liquidating their longs on the Euro (EUR) in the North American session on Monday after strong initial gains. The German economy has been contracting for the last two years, and its outlook is weak due to fears of potential tariffs by United States (US) President Donald Trump.
- ECB policymaker and Bundesbank President Joachim Nagel said last week that our “strong export orientation” makes us “particularly vulnerable” to potential Trump tariffs.
- On the economic front, Eurozone Q4 Negotiated Wage Rates data came in at 4.12%, down from 5.43% in the previous quarter. Soft Eurozone wage data appears contrary to comments from the European Central Bank (ECB) Executive Board Isabel Schnabel who said last week that the central bank could announce a "halt" in the policy-expansion cycle after she warned that domestic inflation was "still high" and wage growth was "still elevated", amid "new shocks to energy prices. Decelerating wage growth would boost expectations of more ECB interest rate cuts this year.
Technical Analysis: EUR/USD revisits 1.0500
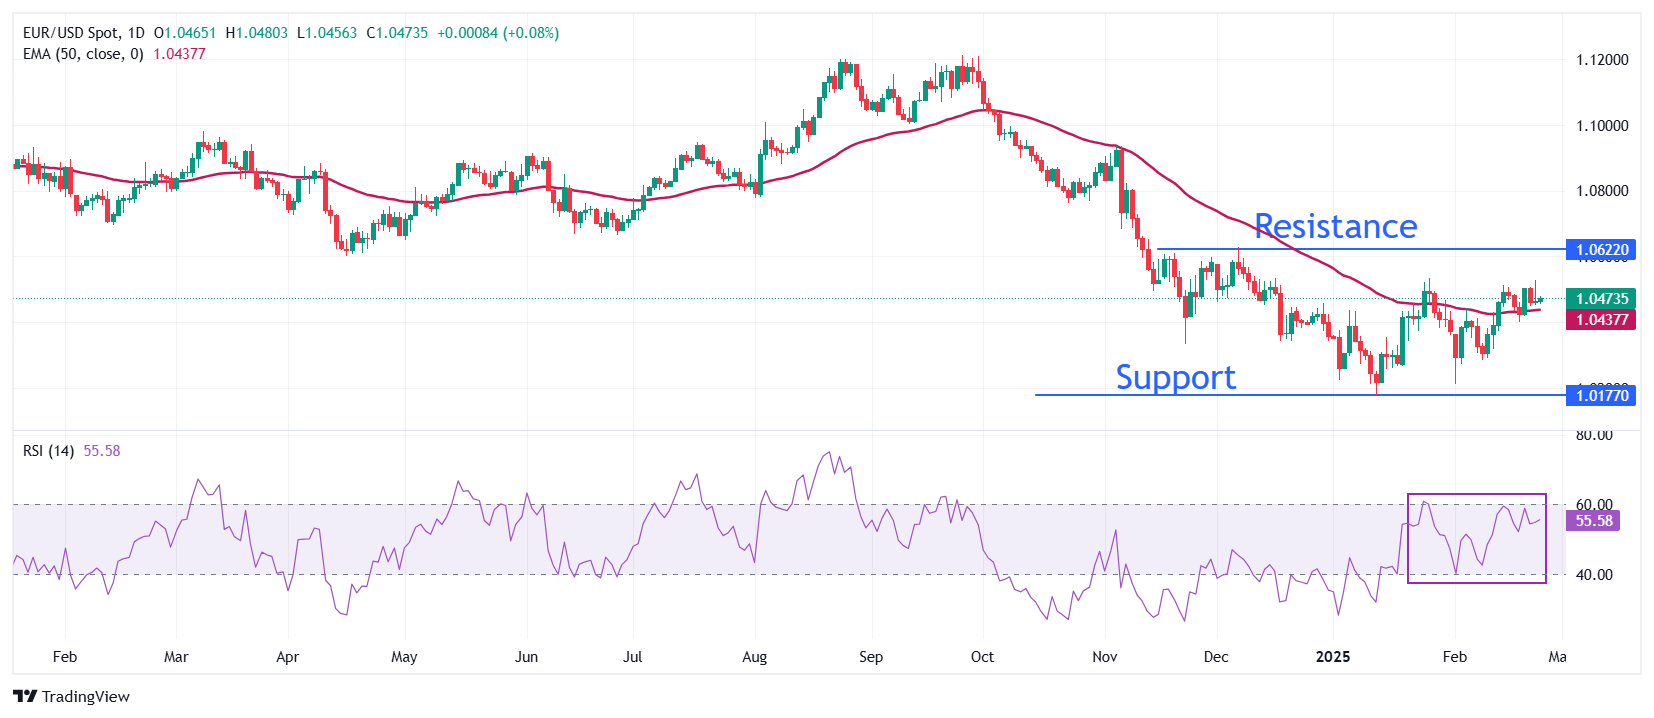
EUR/USD moves higher to near 1.05000 in Tuesday’s North American session. The major currency pair had been struggling to have a decisive breakout above the psychological resistance of 1.0500 from more than a week. The 50-day Exponential Moving Average (EMA) continues to support the major currency pair around 1.0440.
The 14-day Relative Strength Index (RSI) wobbles just below 60.00. A bullish momentum would activate if the RSI (14) manages to sustain above that level.
Looking down, the February 10 low of 1.0285 will act as the major support zone for the pair. Conversely, the December 6 high of 1.0630 will be the key barrier for the Euro bulls.
ECB FAQs
The European Central Bank (ECB) in Frankfurt, Germany, is the reserve bank for the Eurozone. The ECB sets interest rates and manages monetary policy for the region. The ECB primary mandate is to maintain price stability, which means keeping inflation at around 2%. Its primary tool for achieving this is by raising or lowering interest rates. Relatively high interest rates will usually result in a stronger Euro and vice versa. The ECB Governing Council makes monetary policy decisions at meetings held eight times a year. Decisions are made by heads of the Eurozone national banks and six permanent members, including the President of the ECB, Christine Lagarde.
In extreme situations, the European Central Bank can enact a policy tool called Quantitative Easing. QE is the process by which the ECB prints Euros and uses them to buy assets – usually government or corporate bonds – from banks and other financial institutions. QE usually results in a weaker Euro. QE is a last resort when simply lowering interest rates is unlikely to achieve the objective of price stability. The ECB used it during the Great Financial Crisis in 2009-11, in 2015 when inflation remained stubbornly low, as well as during the covid pandemic.
Quantitative tightening (QT) is the reverse of QE. It is undertaken after QE when an economic recovery is underway and inflation starts rising. Whilst in QE the European Central Bank (ECB) purchases government and corporate bonds from financial institutions to provide them with liquidity, in QT the ECB stops buying more bonds, and stops reinvesting the principal maturing on the bonds it already holds. It is usually positive (or bullish) for the Euro.
Forex News
Keep up with the financial markets, know what's happening and what is affecting the markets with our latest market updates. Analyze market movers, trends and build your trading strategies accordingly.