Silver Price Forecast: XAG/USD remains depressed near $32.00; bullish bias remains
- Silver retreats from a three-month high, though the downside seems limited.
- The technical setup supports prospects for the emergence of some dip-buying.
- A convincing break below the $31.00 mark would negate the positive outlook.
Silver (XAG/USD) attracts some sellers following an intraday uptick on Thursday and snaps a three-day winning streak to a three-month top, around the $32.55 region touched the previous day. The white metal sticks to its intraday losses and currently trades near the lower end of its daily range, around the $32.00 mark, down 0.75% for the day.
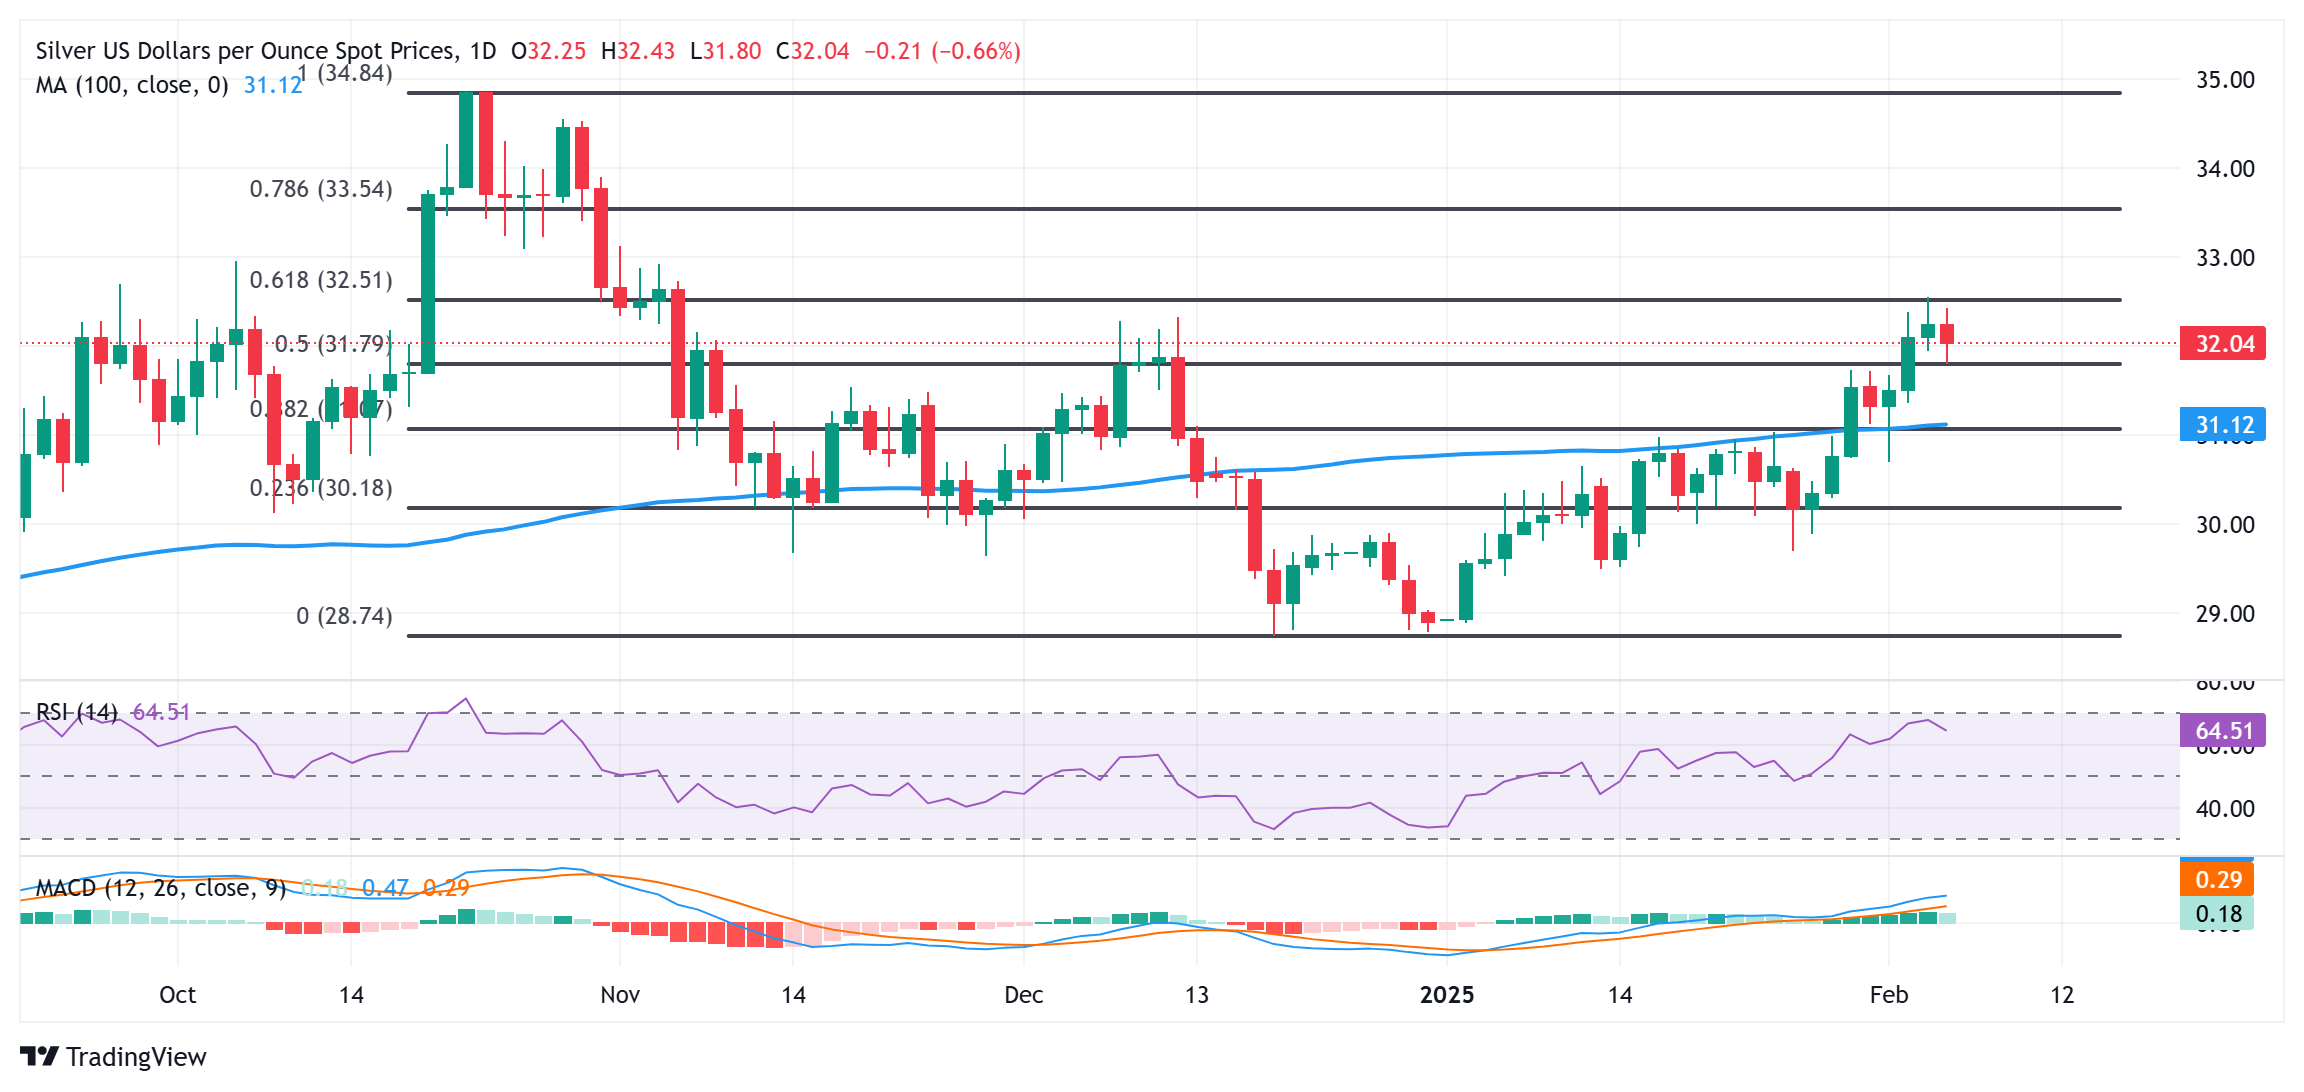
From a technical perspective, the recent breakout through the $31.00 confluence – comprising the 38.2% Fibonacci retracement level of the October-December fall and the 100-day Simple Moving Average (SMA) – was seen as a key trigger for bulls. A subsequent strength beyond the 50% retracement level, around the $31.70-$31.75 region, and positive oscillators on the daily chart validate the constructive setup.
Hence, any further slide below the $31.75-$31.70 area, or the daily swing low, could be seen as a buying opportunity. This, in turn, should help limit the downside for the XAG/USD near the $31.00 resistance breakpoint, now turned support. A convincing break below the latter, however, could make the XAG/USD vulnerable to accelerate the fall toward the $30.25 support zone en route to the $30.00 psychological mark.
On the flip side, the $32.55 area, or a multi-month peak touched on Wednesday, now seems to act as an immediate hurdle. Some follow-through buying should allow the XAG/USD to climb further towards reclaiming the $33.00 mark for the first time since early November. The said handle also represents the 61.8% Fibo. level, which if cleared decisively will set the stage for an extension of over a one-month-old uptrend.
Silver daily chart
Silver FAQs
Silver is a precious metal highly traded among investors. It has been historically used as a store of value and a medium of exchange. Although less popular than Gold, traders may turn to Silver to diversify their investment portfolio, for its intrinsic value or as a potential hedge during high-inflation periods. Investors can buy physical Silver, in coins or in bars, or trade it through vehicles such as Exchange Traded Funds, which track its price on international markets.
Silver prices can move due to a wide range of factors. Geopolitical instability or fears of a deep recession can make Silver price escalate due to its safe-haven status, although to a lesser extent than Gold's. As a yieldless asset, Silver tends to rise with lower interest rates. Its moves also depend on how the US Dollar (USD) behaves as the asset is priced in dollars (XAG/USD). A strong Dollar tends to keep the price of Silver at bay, whereas a weaker Dollar is likely to propel prices up. Other factors such as investment demand, mining supply – Silver is much more abundant than Gold – and recycling rates can also affect prices.
Silver is widely used in industry, particularly in sectors such as electronics or solar energy, as it has one of the highest electric conductivity of all metals – more than Copper and Gold. A surge in demand can increase prices, while a decline tends to lower them. Dynamics in the US, Chinese and Indian economies can also contribute to price swings: for the US and particularly China, their big industrial sectors use Silver in various processes; in India, consumers’ demand for the precious metal for jewellery also plays a key role in setting prices.
Silver prices tend to follow Gold's moves. When Gold prices rise, Silver typically follows suit, as their status as safe-haven assets is similar. The Gold/Silver ratio, which shows the number of ounces of Silver needed to equal the value of one ounce of Gold, may help to determine the relative valuation between both metals. Some investors may consider a high ratio as an indicator that Silver is undervalued, or Gold is overvalued. On the contrary, a low ratio might suggest that Gold is undervalued relative to Silver.
Forex News
Keep up with the financial markets, know what's happening and what is affecting the markets with our latest market updates. Analyze market movers, trends and build your trading strategies accordingly.