Pound Sterling slumps against USD as US NFP looms large
- The Pound Sterling faces pressure against its major peers ahead of the BoE’s monetary policy on Thursday.
- The BoE is widely anticipated to cut interest rates by 25 bps to 4.5%.
- Investors await the US NFP data, which will influence expectations for the Fed’s monetary policy outlook.
The Pound Sterling (GBP) slumps to near 1.2440 against the US Dollar (USD) in Thursday’s European session. The GBP/USD pair edges lower as the US Dollar gains ground ahead of the United States (US) Nonfarm Payrolls (NFP) data for January, which will be released on Friday.
The US Dollar Index (DXY), which tracks the Greenback’s value against six major currencies, finds a temporary support near 107.30 after a three-day sell-off from the two-week high near 110.00.
The official United States (US) employment data is expected to drive market speculation about how long the Federal Reserve (Fed) will hold interest rates at their current levels. Last week, Fed Chair Jerome Powell said that they would make monetary policy adjustments only after seeing “real progress in inflation or at least some weakness in the labor market” after the central bank left interest rates unchanged in the range of 4.25%-4.50%.
According to the CME FedWatch tool, the Fed is expected to announce its next interest rate cut in June’s policy meeting.
The US Dollar witnessed a sharp sell-off in the first three trading days of the week as fears of a global trade war receded. Investors expect the trade war to remain between the US and China as the latter retaliated to US President Donald Trump’s imposition of 10% tariffs with 15% levies on Coal and Liquified Natural Gas (LNG) and 10% on Crude Oil, farm equipment and some autos. Meanwhile, President Trump suspended 25% tariff orders on Canada and Mexico for 30 days.
Daily digest market movers: Pound Sterling declines amid caution ahead of BoE’s policy decision
- The Pound Sterling weakens against its major peers on Thursday ahead of the Bank of England’s (BoE) monetary policy decision, which will be announced at 12:00 GMT. The BoE is almost certain to cut interest rates by 25 basis points (bps) to 4.5%, with an 8-1 vote split. Monetary Policy Committee (MPC) member Catherine Mann, who has been an outspoken hawk, is expected to support keeping interest rates unchanged at 4.75%.
- The BoE is expected to announce an interest rate cut decision in an attempt to revive labor demand amid stagnating economic growth. This would be the third interest rate cut by the BoE in its current policy-easing cycle, which started at the August 2024 policy meeting.
- United Kingdom (UK) employers have tempered the pace of hiring after Chancellor of the Exchequer Rachel Reeves announced an increase in employers’ contributions to National Insurance (NI). The last three employment readings suggest the labor force rose at a declining pace.
- The UK Gross Domestic Product (GDP) growth remained flat in the third quarter and in the October-November period.
- Investors will pay close attention to BoE Governor Andrew Bailey’s press conference after the policy decision to get cues about the inflation outlook and the monetary policy guidance.
- Inflationary pressures in the UK decelerated at a faster-than-expected pace in December. Still, analysts at Citi expect an uptick in inflation ahead due to a sharp increase in wage growth and a reversal in energy prices.
- Meanwhile, traders are pricing in a 56 bps interest rate reduction for the entire year after a quarter-to-percent cut on Thursday.
British Pound PRICE Today
The table below shows the percentage change of British Pound (GBP) against listed major currencies today. British Pound was the strongest against the New Zealand Dollar.
| USD | EUR | GBP | JPY | CAD | AUD | NZD | CHF | |
|---|---|---|---|---|---|---|---|---|
| USD | 0.40% | 0.62% | -0.08% | 0.26% | 0.33% | 0.49% | 0.42% | |
| EUR | -0.40% | 0.21% | -0.49% | -0.14% | -0.08% | 0.09% | -0.01% | |
| GBP | -0.62% | -0.21% | -0.72% | -0.35% | -0.30% | -0.12% | -0.20% | |
| JPY | 0.08% | 0.49% | 0.72% | 0.35% | 0.41% | 0.54% | 0.50% | |
| CAD | -0.26% | 0.14% | 0.35% | -0.35% | 0.07% | 0.23% | 0.16% | |
| AUD | -0.33% | 0.08% | 0.30% | -0.41% | -0.07% | 0.17% | 0.07% | |
| NZD | -0.49% | -0.09% | 0.12% | -0.54% | -0.23% | -0.17% | -0.07% | |
| CHF | -0.42% | 0.00% | 0.20% | -0.50% | -0.16% | -0.07% | 0.07% |
The heat map shows percentage changes of major currencies against each other. The base currency is picked from the left column, while the quote currency is picked from the top row. For example, if you pick the British Pound from the left column and move along the horizontal line to the US Dollar, the percentage change displayed in the box will represent GBP (base)/USD (quote).
Technical Analysis: Pound Sterling falls back below 1.2500
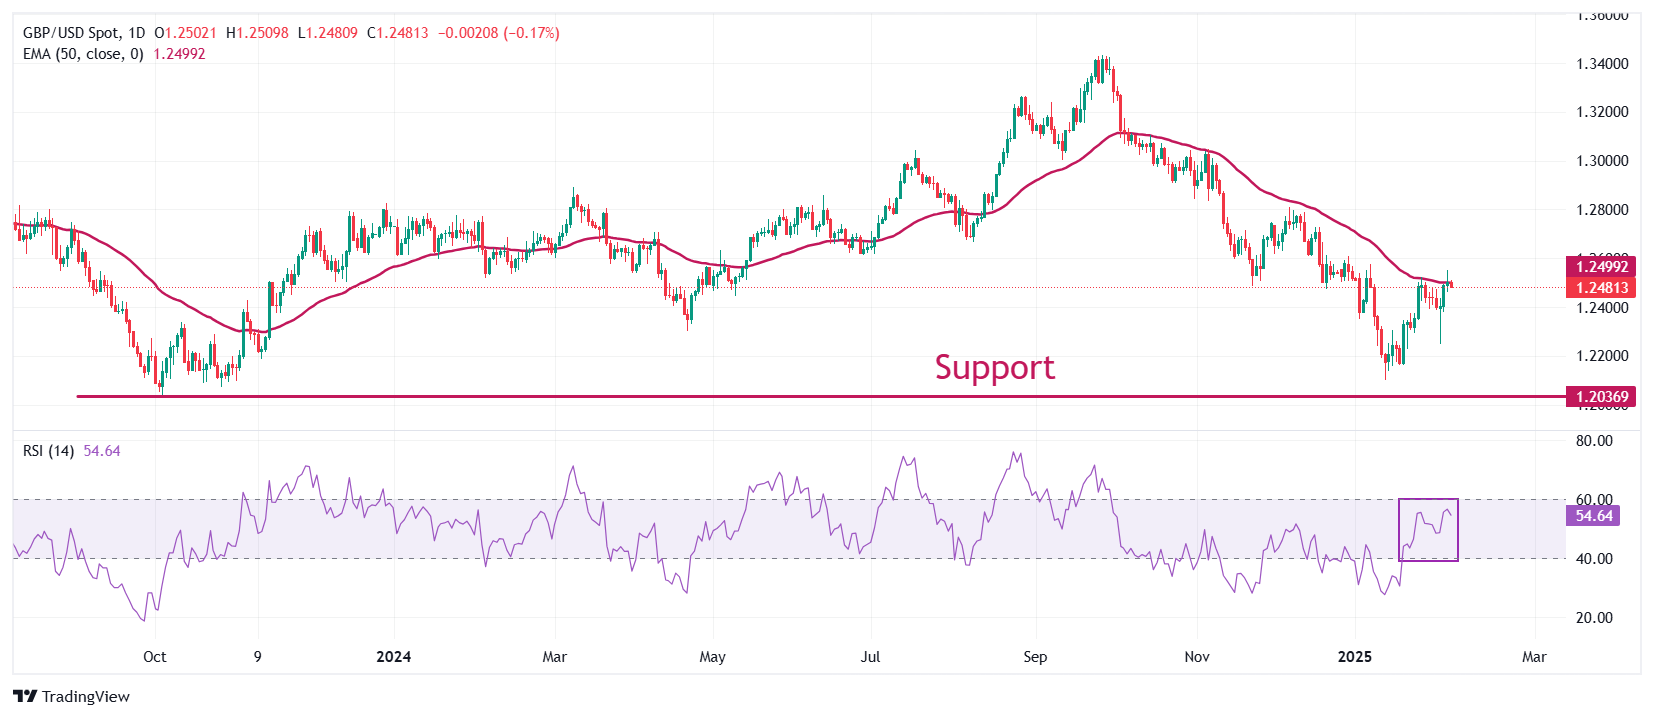
The upside move in the Pound Sterling against the US Dollar has paused after rising above the psychological figure of 1.2500, which also coincided with the zone where the 50-day Exponential Moving Average (EMA) wobbles.
The 14-day Relative Strength Index (RSI) oscillates inside the 40.00-60.00 range, suggesting a sideways trend.
Looking down, the January 13 low of 1.2100 and the October 2023 low of 1.2050 will act as key support zones for the pair. On the upside, the December 30 high of 1.2607 will act as key resistance.
Forex News
Keep up with the financial markets, know what's happening and what is affecting the markets with our latest market updates. Analyze market movers, trends and build your trading strategies accordingly.