GBP/USD rises as UK GDP beat estimates, US inflation stays hot
- UK GDP surprises with 0.1% growth, defying recession fears.
- US PPI inflation exceeds expectations, reinforcing Fed’s cautious stance on rate cuts.
- GBP/USD holds gains, but technical outlook still favors downside below 1.2473.
The Pound Sterling (GBP) registered solid gains versus the US Dollar (USD) on Thursday after GDP figures in the United Kingdom (UK) surprisingly beat estimates. Meanwhile, inflation in the United States (US) rose and job data shows that the labor market remains strong. The GBP/USD pair trades at 1.2510, up 0.53%.
Sterling gains but BoE’s and Fed divergence caps upside potential
Data saved the British Pound after the Q4 2024 preliminary reading showed the economy grew 0.1% QoQ, exceeding estimates for a -0.1% contraction. On a yearly basis, Gross Domestic Product (GDP) increased by 1.4%, which is above forecasts and the previous reading of 1%.
In the US, the US Bureau of Labor Statistics (BLS) revealed that the Producer Price Index (PPI) came at 0.4% MoM in January, above estimates of 0.3%, down from 0.5%. In year-over-year (YoY) data, the PPI rose by 3.5%, exceeding forecasts.
Core figures also came slightly hot, with monthly figures rising 0.3% as estimated. In the twelve months to January, the Core PPI increased by 3.6%, three-tenths above the 3.3% projection.
Other data showed that Initial Jobless Claims for the week ending February 8 rose by 213K, below estimates of 215K, and the February 1 reading of 220K.
Given the backdrop, the GBP/USD pair is trading in the green, though divergence amongst central banks favors further downside. After the UK’s GDP data, markets fully priced in the next cut in June and expect 55 basis points of easing by the Bank of England (BoE) towards the end of 2025.
Nevertheless, the BoE’s Chief Economist Huw Pill said that he expects further rate cuts but urges caution as the disinflation process is not complete.
Meanwhile, the Fed adopted a cautious stance after the latest readings of inflation indicated the disinflation process stalled after five straight months of price increases. On Wednesday, Fed Chair Jerome Powell said, “We are close but not there on inflation,” adding, “We want to keep policy restrictive for now.”
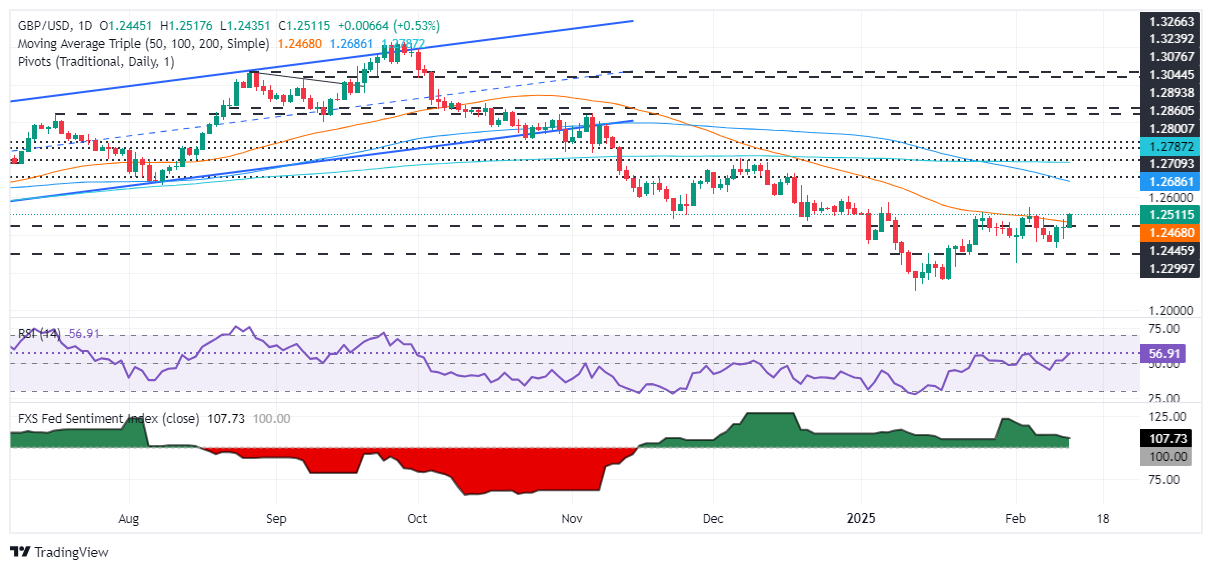
GBP/USD Price Forecast: Technical outlook
GBP/USD downtrend remains intact as depicted by the daily chart. But if buyers reclaim the February 5 high of 1.2549, the bias shifts to neutral as the pair had achieved a higher-high, an indication of a trend shift. Further upside lies at 1.2600, and buyers may challenge the 100-day Simple Moving Average (SMA) at 1.2700.
Conversely, if GBP/USD drops below the 50-day SMA at 1.2473, sellers could push prices toward the 1.2400 mark.
(This story was corrected on Thursday 13 at 17:07 GMT to say that UK GDP increased by 1.4% YoY in Q4, not 1.5%)
British Pound PRICE Today
The table below shows the percentage change of British Pound (GBP) against listed major currencies today. British Pound was the strongest against the US Dollar.
| USD | EUR | GBP | JPY | CAD | AUD | NZD | CHF | |
|---|---|---|---|---|---|---|---|---|
| USD | -0.39% | -0.53% | -0.54% | -0.41% | -0.07% | -0.08% | -0.75% | |
| EUR | 0.39% | -0.15% | -0.13% | -0.02% | 0.30% | 0.30% | -0.37% | |
| GBP | 0.53% | 0.15% | -0.02% | 0.12% | 0.46% | 0.44% | -0.23% | |
| JPY | 0.54% | 0.13% | 0.02% | 0.12% | 0.46% | 0.40% | -0.23% | |
| CAD | 0.41% | 0.02% | -0.12% | -0.12% | 0.35% | 0.32% | -0.35% | |
| AUD | 0.07% | -0.30% | -0.46% | -0.46% | -0.35% | -0.02% | -0.69% | |
| NZD | 0.08% | -0.30% | -0.44% | -0.40% | -0.32% | 0.02% | -0.67% | |
| CHF | 0.75% | 0.37% | 0.23% | 0.23% | 0.35% | 0.69% | 0.67% |
The heat map shows percentage changes of major currencies against each other. The base currency is picked from the left column, while the quote currency is picked from the top row. For example, if you pick the British Pound from the left column and move along the horizontal line to the US Dollar, the percentage change displayed in the box will represent GBP (base)/USD (quote).
Forex News
Keep up with the financial markets, know what's happening and what is affecting the markets with our latest market updates. Analyze market movers, trends and build your trading strategies accordingly.