AUD/CAD rangebound pauses rally
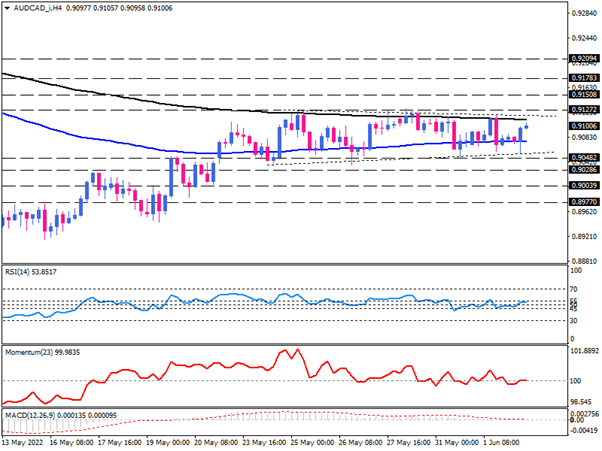
After climbing from almost four-month lows, AUD/CAD has stuck in a range between the 0.91272 resistance and the 0.90482 support on the four-hour chart. The price is consolidating between converging EMAs with no clear directional clue. At the same time, momentum oscillators are exhibiting sideways, with RSI hovering in the neutral zone between 55 and 45. Likewise, momentum has been attached to the 100-threshold for a while, implying a lack of persistent directional momentum in the market. Also, MACD bars have shrunk around the zero-line, with descending signal line flattening near zero.
In the event that buyers continue to climb towards the range ceiling at 0.91272, only mounting this barrier can prove the pair is gaining upside momentum. If that is the case, the immediate resistance can be projected at the 0.91508 hurdle, which is in line with the top of May 6. Breaking above this hurdle can prove intensifying bullish momentum and lead the price toward the 0.91783 barrier. Further traction may result in reaching the next resistance at the 0.92094 mark.
Alternatively, suppose the current continuation pattern holds. In that case, the 200 EMA may halt further gains and encourage sellers to join, aiming for the range floor around 0.90482. only a decisive break of this obstacle can imply the beginning of a downward movement with the immediate support coming from 0.90286. if sellers manage to clear this roadblock, selling forces will pave the door towards the 0.90039 and 0.89770, respectively.

Technical Analysis
Discover ideal profit opportunities for your everyday trading with the help of our in-depth technical insights comprised of facts, charts and trends.


