Gold: Is the Glitter Fading?
The precious metal, gold, often perceived as a safe-haven asset, presented some intriguing twists on its one-hour chart on Tuesday.
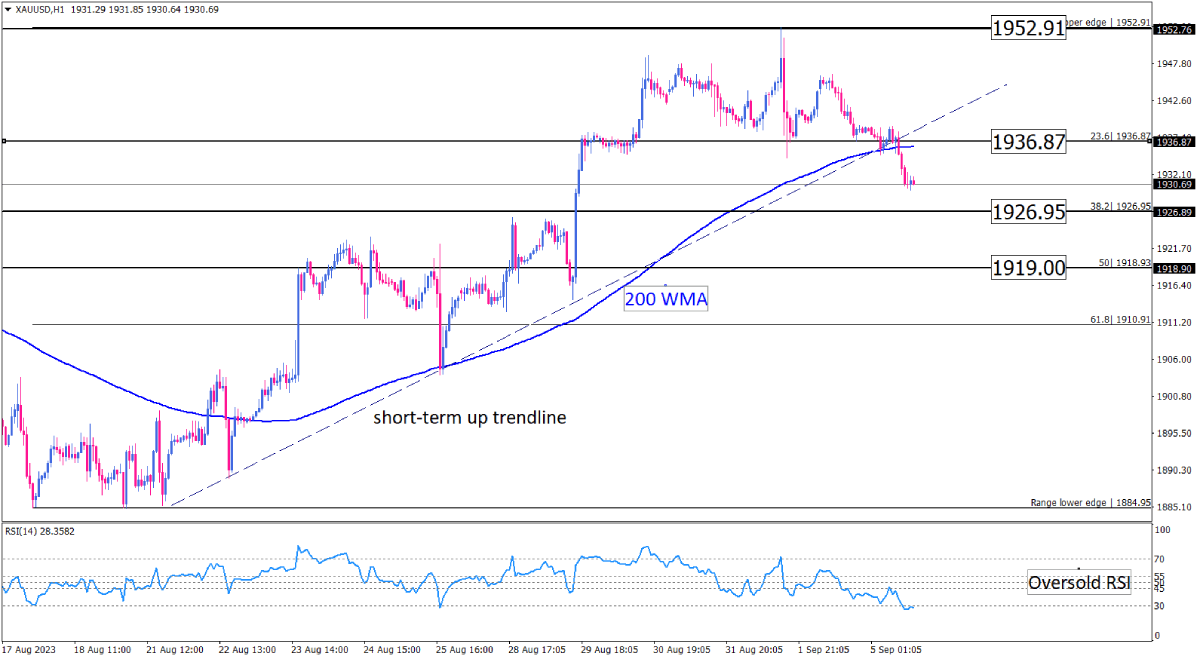
Post its ascent to the summit of 1952.91 at the dawn of September 2023, gold's bullish gusto seems to have waned. The sellers, sensing an opportunity, have navigated the price below pivotal support at 1936.87. This level is not just a mere number; it represents a confluence of the upward trendline and the 23.6% Fibonacci retracement of the preceding uptrend.
Current Technical Landscape
Gold is now trading beneath the 200-week Moving Average (WMA), painting a bearish tableau. If the sellers maintain their current stranglehold, the next destination on their radar might be the 38.2% Fibonacci retracement level, which stands at 1926.95.
Oscillator Insights
The RSI's position in the oversold domain is pivotal. While it indicates the potential exhaustion of sellers, it's crucial to remember that assets can remain overbought or oversold for extended periods. Thus, while the RSI suggests a possible respite in selling, confirmation from the price action is vital before drawing any conclusions.

A Bullish Detour – The Alternate Scenario
The Relative Strength Index (RSI) offers a counter-narrative. Currently immersed in the oversold territory, it suggests that the sellers might be overextending, and their relentless drive could momentarily pause. If this happens and buying sentiment rejuvenates, we could witness a corrective phase. The primary targets in this scenario would be the 200-WMA and the recently breached support of 1936.87, which has now morphed into a resistance.
Conclusion
The one-hour chart of gold currently leans bearish, with the metal trading below key technical indicators. However, oscillators hint at a potential breather, suggesting traders should be on the lookout for both continued bearish moves and potential bullish corrections. As always, blending this technical perspective with global economic events, especially those affecting gold, will offer a holistic trading strategy.
Disclaimer: The above analysis is purely for informational purposes and should not be construed as investment advice. Always consult with a financial advisor before making any trading decisions.
Technical Analysis
Discover ideal profit opportunities for your everyday trading with the help of our in-depth technical insights comprised of facts, charts and trends.


