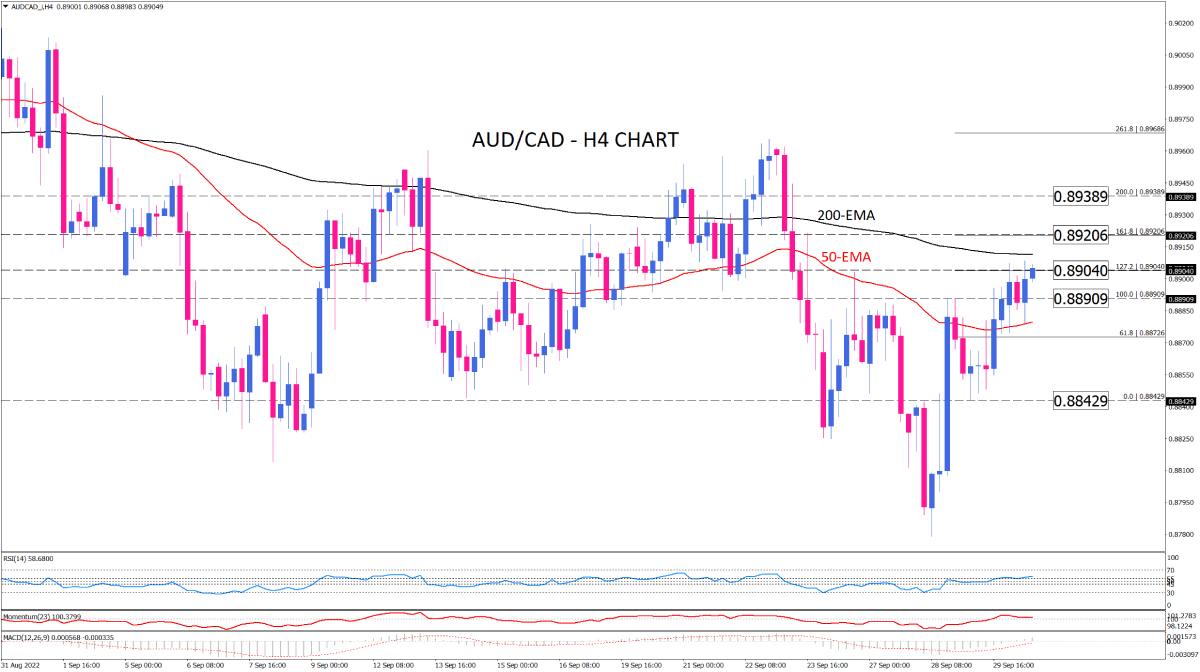
AUD/CAD recovery stalled at a key resistance
AUD/CAD on the four-hour chart is approaching the 200-EMA through its recovery from two and a half months' lows. The price is taking a rest between short and long EMAs, following a break above the key level of 0.88909. The move is followed by buyers, tackling the 0.89040 hurdle at the vicinity of 200-EMA to break the consolidation to the upside. If they succeed in clearing this obstacle, the next resistance at 0.89206 will counter the rally. Overstepping this barrier can encourage more buyers to keep rallying towards the 0.89389 mark.
Otherwise, should sellers defend the long EMA, the pair will swing sideways between EMAs for a longer period of time. If bearish sentiment pushes the price down below the 50-EMA, 0.88429 can prove to be the next support.
Short-term momentum oscillators imply intensifying bullish sentiment. RSI is moving upward in the buying region. Momentum is holding above the 100-threshold. MACD bars have crossed the zero line, growing in the positive area.

Technical Analysis
Discover ideal profit opportunities for your everyday trading with the help of our in-depth technical insights comprised of facts, charts and trends.


