AUD/CAD sellers continue to dominate near-term
AUD/CAD is likely to remain on the back foot in the short term due to weak global growth, stagflation risks and extending Chinese lockdowns.
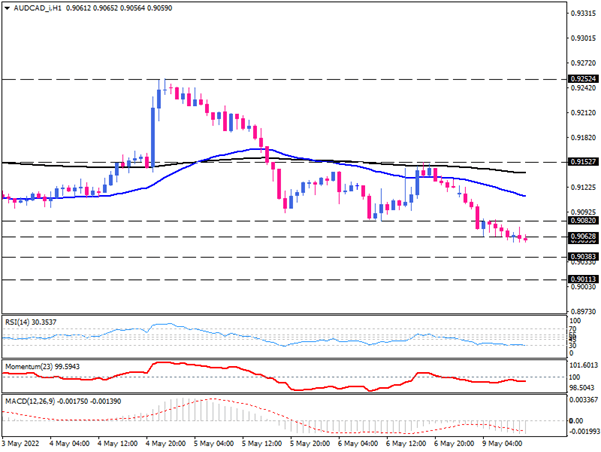
A downward trend can be seen on the hourly chart of AUD/CAD as it dips below the 50 and 200 exponential moving averages by making lower tops and lower bottoms. EMAs with negative slopes are also exhibiting bearish momentum as sellers try to confirm a break of the 0.90628 support level aligned with the 1.27% Fibonacci extension of the prior up-leg swing from 0.90820 to 0.91527.
Momentum oscillators are indicating the strength of selling forces with RSI near 30 and momentum hovering under the 100-threshold. Likewise, MACD histograms stand on the short side since MACD bars are growing in negative territory below the falling signal line.
Bears look likely to push prices lower, aiming for the 0.90383 mark, waiting at the 161.8% Fibonacci extension level.
In the case of prevailing bearish sentiment, a sustained move below the 0.90383 mark can trigger further decline and put the 0.90113 barrier in the spotlight.
Otherwise, should buyers take cues from the oversold RSI reading, they may take control of the market, reclaiming the 0.90820 at the previous market bottom. This action will cause some consolidation to the upside. Nevertheless, we need to see a clear break above moving averages for the market to turn bullish.

Technical Analysis
Discover ideal profit opportunities for your everyday trading with the help of our in-depth technical insights comprised of facts, charts and trends.


