

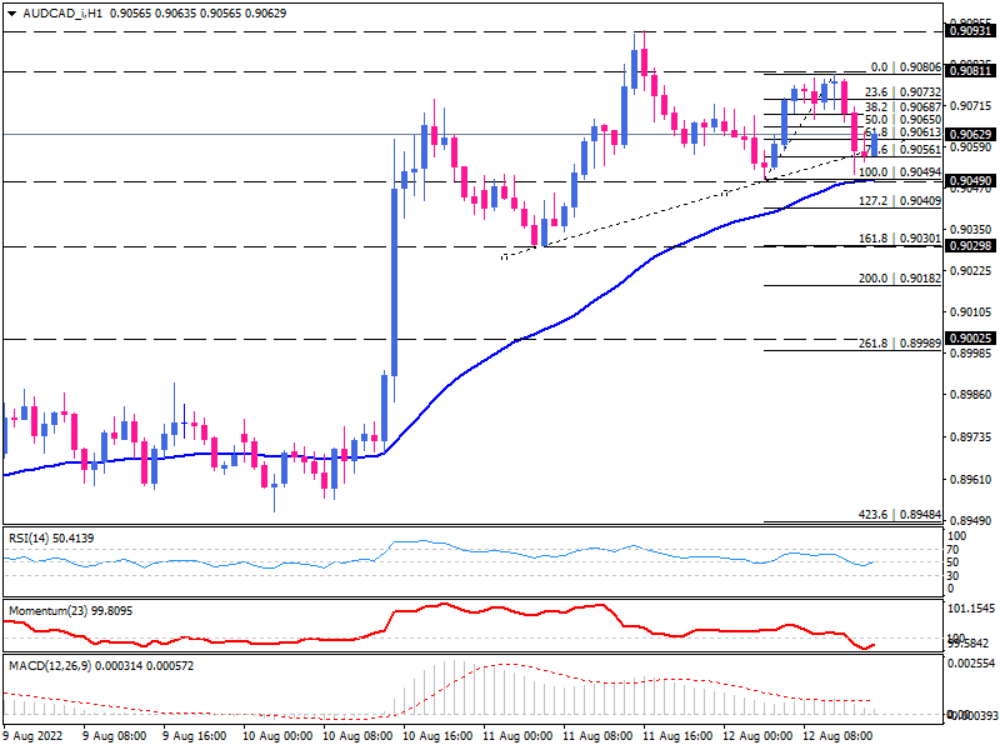
AUD/CAD struggling a key support to complete a reversal pattern
After a course of falling from the top of 0.90806, AUD/CAD on the one-hour chart has formed a head and shoulders pattern with prices stuck around the neckline. If sellers manage to close below this hurdle, the 50-EMA will be the next support, coinciding with the 0.90494 mark. If this level fails to stand the decline, a lower breach can send the price towards 0.90409. With prevailing bearish momentum in the wake of a stronger Loonie, the previous market bottom of 0.90301 can confront the fall around the 161.8% Fibonacci projection level of the prior upswing.
Otherwise, if the neckline keeps intact, buyers may reverse the move towards the 0.90806, and the pattern will remain on standby for further confirmation. Only a break above that hurdle can be an indication of pattern invalidation.
Short-term momentum oscillators imply bearish bias. RSI is beneath the 50-level in a slight downward trend, suggesting sellers are overcoming slowly. Momentum is running below the 100-threshold in the selling region. MACD bars retreat the signal line towards zero, indicating fading short-term bullish sentiment.
Technical Analysis
Discover ideal profit opportunities for your everyday trading with the help of our in-depth technical insights comprised of facts, charts and trends.


