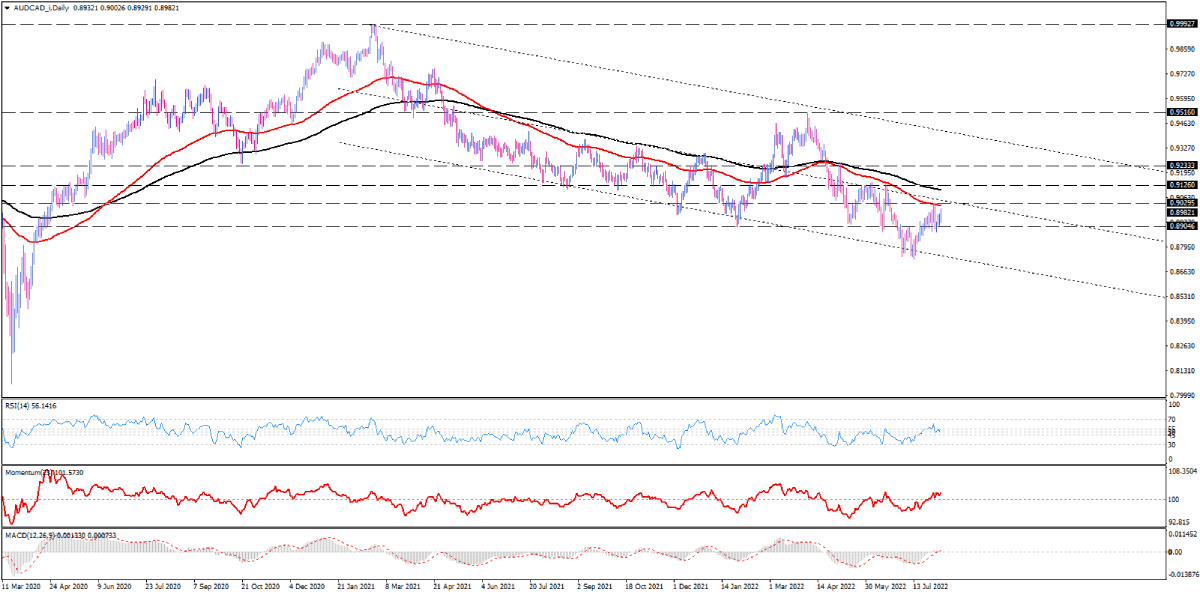
AUD/CAD upside momentum is gaining
Looking at the daily chart, AUD/CAD has been trading in a descending channel since February 2021. The pair formed a double-bottom pattern at the channel's lower line mid-July. Once buyers broke above the 0.89046 neckline, bullish momentum fuelled the price to meet the 50-EMA, which has been a reliable resistance since May 2022. By pulling back from the broken support line, buying forces are driving AUD/CAD higher again to reclaim the 50-day EMA, which lies on 0.90295. Should bulls succeed in overcoming this hurdle, it can keep buyers hopeful of meeting the 200-day EMA again around the 0.91260 barrier. If bullish sentiment persists above this obstacle, bulls will continue the party towards 0.92333.
Alternatively, suppose the 50-day exponential moving average holds resistance. In that case, the pair may swing down, playing in a range between 0.90295 and 0.89046 until one side takes absolute control by breaking either of the range boundaries.
Short-term momentum oscillators suggest buying pressure is increasing. RSI has pushed out of the neutral zone to keep its uptrend. Momentum is trending upward in buying region, and MACD bars are growing in the positive area, above the signal line.

Technical Analysis
Discover ideal profit opportunities for your everyday trading with the help of our in-depth technical insights comprised of facts, charts and trends.


