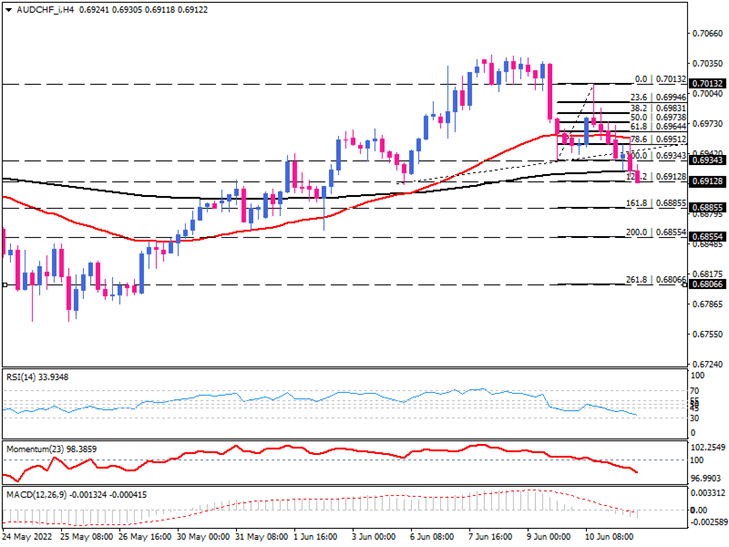
AUD/CHF negative momentum intensifies following a bearish reversal
The Australian dollar has exhibited a bearish flag against the Swiss franc on the four-hour chart by forming a head and shoulders pattern. After retreating from the 0.70132 market top, sellers broke below the neckline in early trade on Monday. The pair is struggling with the 200 EMA. As it turns out, sellers tend to violate this key support area at the confluence of 23.6% Fibo level around 0.69130s.
The bearish scenario could play out if sellers break below this hurdle. A further decline can drag the 0.68855 mark into the spotlight if that's the case. Continuing below this level can push the pair towards the next support estimated at around 0.68554. A sustained move below this barrier may send the price towards the 0.68066 later if the negative momentum continues.
By contrast, if 0.69128 holds, the pair will likely remain sideways, aiming for the broken neckline around 0.69512, which lines up with the 50 exponential moving average. Breaking this barrier could lead to buyers reclaiming the previous level of interest at 0.70132. A breach above this latter will invalidate the reversal pattern.
The short-term momentum oscillators paint a BEARISH picture. The RSI has pulled out in the selling region, speeding up towards the 70 level. Also, momentum has drawn a downward movement below the 100-baseline. Similarly, MACD bars are growing in the negative area, indicating gaining bearish momentum. At the same time, the signal line has crossed below the zero line, supporting the overall selling pressures.

Technical Analysis
Discover ideal profit opportunities for your everyday trading with the help of our in-depth technical insights comprised of facts, charts and trends.


