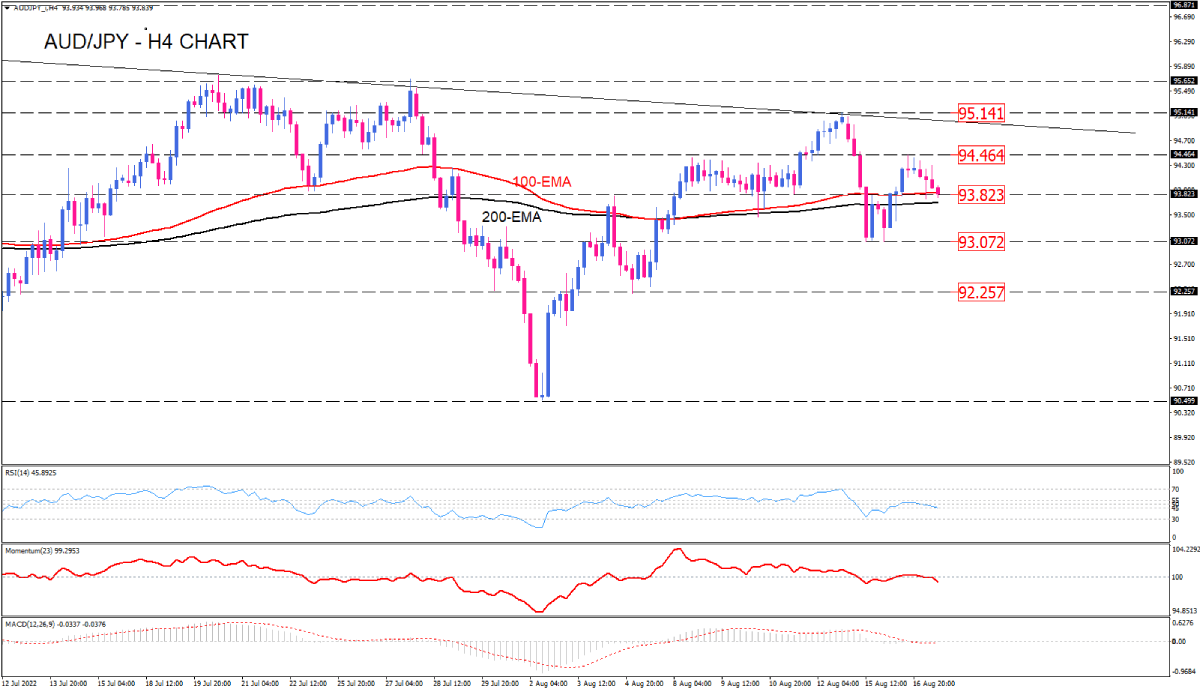
AUD/JPY awaits a clear directional trigger at a key support
On the four-hour chart, after topping at 94.464, AUD/JPY sellers extended drops towards a crucial support area, standing at the boundary of the 100 and 200-EMA confluence. Lowering from August’s highs at 95.150 can be taken as a sign of weakening buying pressure, which resulted in a breach of the uptrend line earlier in the week. Currently, the pair is trading within a range between 94.464 and 93.823. If bearish momentum intensifies, a clear break below the EMAs can trigger a free fall towards Tuesday’s lows around 93.072. Suppose this hurdle fails to limit further losses. In that case, sellers will take the ground below this barrier, highlighting the 92.257 mark as the following support level.
In the event that the confluence of moving averages stands intact, the price may pull back to retest the 94.464 top.
However, short-term oscillators don’t seem to imply a strong enough momentum in the market, which can hint at a period of consolidation near the moving averages. The RSI is challenging at the lower edge of the neutral zone. The momentum is flattening just below the 100-threshold, suggesting that the selling forces have yet to go far. Likewise, MACD bars are attached to the zero-level in the negative region, waiting for more sellers to push the market.

Technical Analysis
Discover ideal profit opportunities for your everyday trading with the help of our in-depth technical insights comprised of facts, charts and trends.


