AUD/NZD uptrend gets out of steam
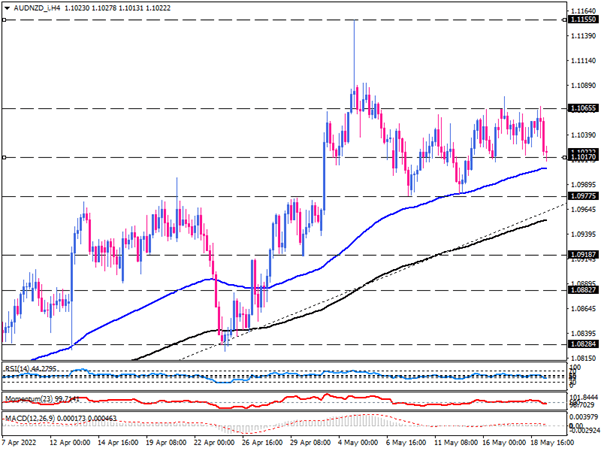
On the four-hour chart, the AUDNZD uptrend is cooling down after two months with prices trading between 1.10655 resistance and 1.10170 support levels. While the short-term oscillators hint that selling pressure is rising in the absence of any directional traction. It comes after the pair lost its momentum for overstepping the 1.10655 after several attempts in the last two weeks.
However, as long as AUDNZD holds above moving averages, the overall picture is considered bullish. If buyers defend the current support level, the pair may remain sideways. A sustained move above the 1.10655 hurdle can pave the way towards the almost four-year high record around 1.11550.
Otherwise, sellers need to cross below the EMAs, making lower lows to establish a new downtrend. If more sellers join the market to overcome the 1.10170 mark, the price may drop below the 100 EMA. Then the 1.09775 barrier around the three-week low will come into the spotlight, which lines up with the ascending trendline. For bears to kick off a new downtrend, they must break below this crucial level.
Given the short-term momentum oscillators, there is not enough directional momentum in the market. RSI has been bouncing within the neutral zone. Likewise, momentum has fluctuated over the 100-threshold, implying a lack of traction. MACD bars are shrinking towards the zero-line while the signal line is flattening.

Technical Analysis
Discover ideal profit opportunities for your everyday trading with the help of our in-depth technical insights comprised of facts, charts and trends.


