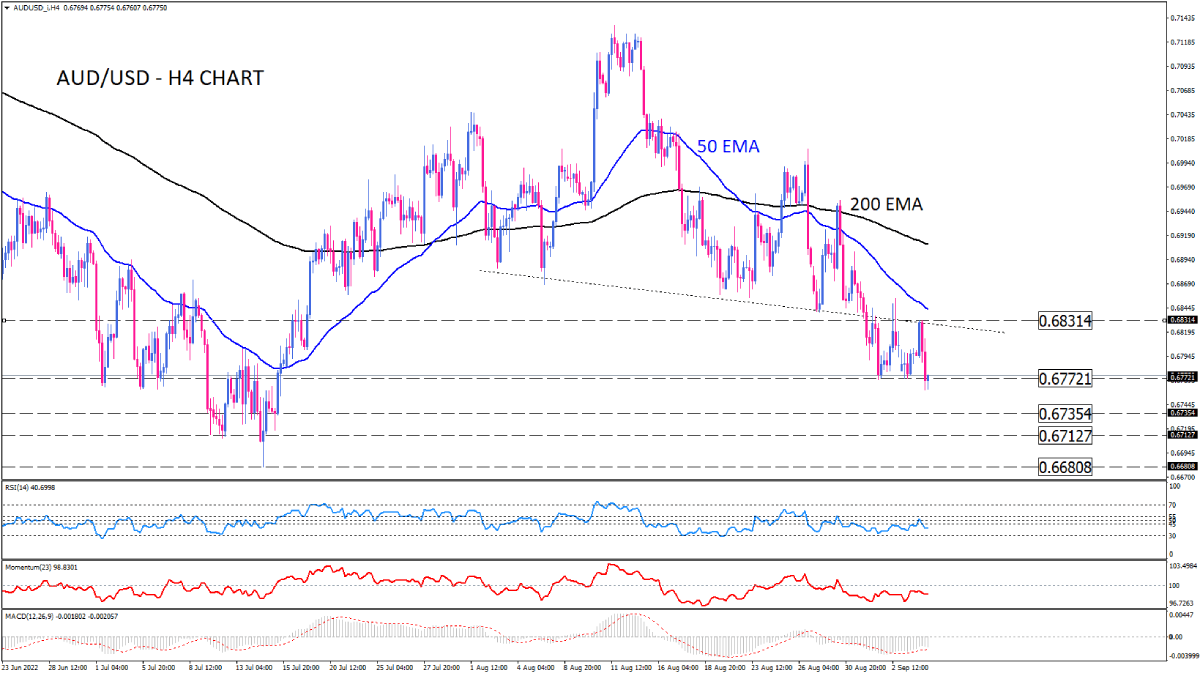
AUD/USD sellers attempt to break a range floor
AUD/USD has been trading downward for some time. Sellers are currently challenged with a critical support level of 0.67721 after several attempts. As seen on the four-chur chart, bearish momentum is prevailing, with the price insisting on breaking this barrier. If sellers manage a decisive break, the next support can be estimated around the 0.67354 hurdle. If this level can’t stop the losses, a further decline will likely push the pair to the 0.67127 barrier. Passing this obstacle can pave the way to land at a two-year low of around 0.66808.
On the flip side, if buyers don’t give up on the 0.67721 support level, the price may stay in a range, heading towards the ceiling of 0.68314.
Short-term momentum oscillators confirm bearish bias in the market. RSI is floating in the selling area, and momentum is hovering below the 100-threshold. MACD histogram posts negative values.

Technical Analysis
Discover ideal profit opportunities for your everyday trading with the help of our in-depth technical insights comprised of facts, charts and trends.


