Bitcoin's bulls tackle a firm resistance
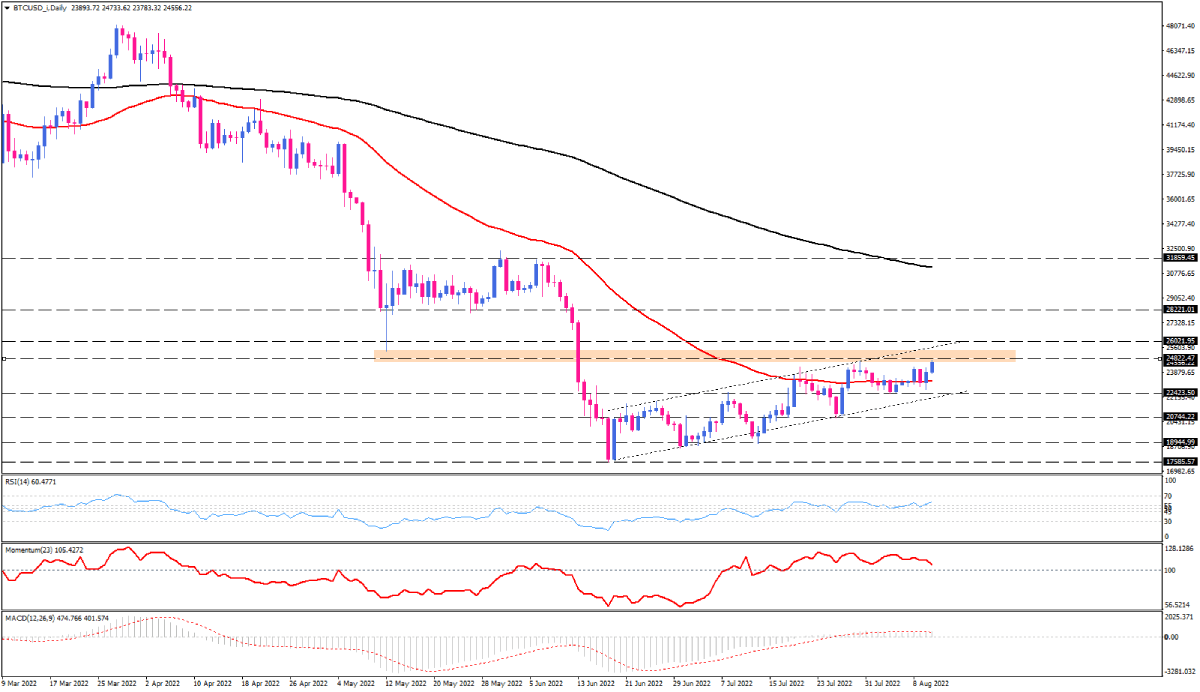
Bitcoin on the daily chart, which has stuck between the support of $22420 and the resistance of $24800 since early August, is edging higher through a significant resistance level at $24800-sub. For the slight uptrend to continue, buyers need to close the price above this hurdle. If they succeed, bitcoin will find a chance to test the channel's upper line, coinciding with $26000. In the event that this latter can't stop the rally, a clear breakout will put the 200-day EMA in the spotlight, having bulls hopeful for reaching the 30,000 psychological level again. This level has proved to be a significant resistance back to May 31 and June 6.
On the downside, sellers will target the 50-day EMA if buyers retreat from the current resistance. A remarkable attempt to tackle this dynamic support can push the bitcoin down towards the previous bottom at $23423. However, the broad picture will remain bullish as long as bitcoin trades within the ascending channel. A decisive break below the channel's support line can trigger a possible reversal in the mid-term.
Short-term momentum oscillators point to a broad positive sentiment. RSI is moving higher in buying area, trending upward above the last peak. On the other hand, Momentum is sliding down towards the 100-threshold, suggesting the bullish bias is cooling a bit. MACD bars are plotting flat values along with a flattening signal line in positive territory.

Technical Analysis
Discover ideal profit opportunities for your everyday trading with the help of our in-depth technical insights comprised of facts, charts and trends.


