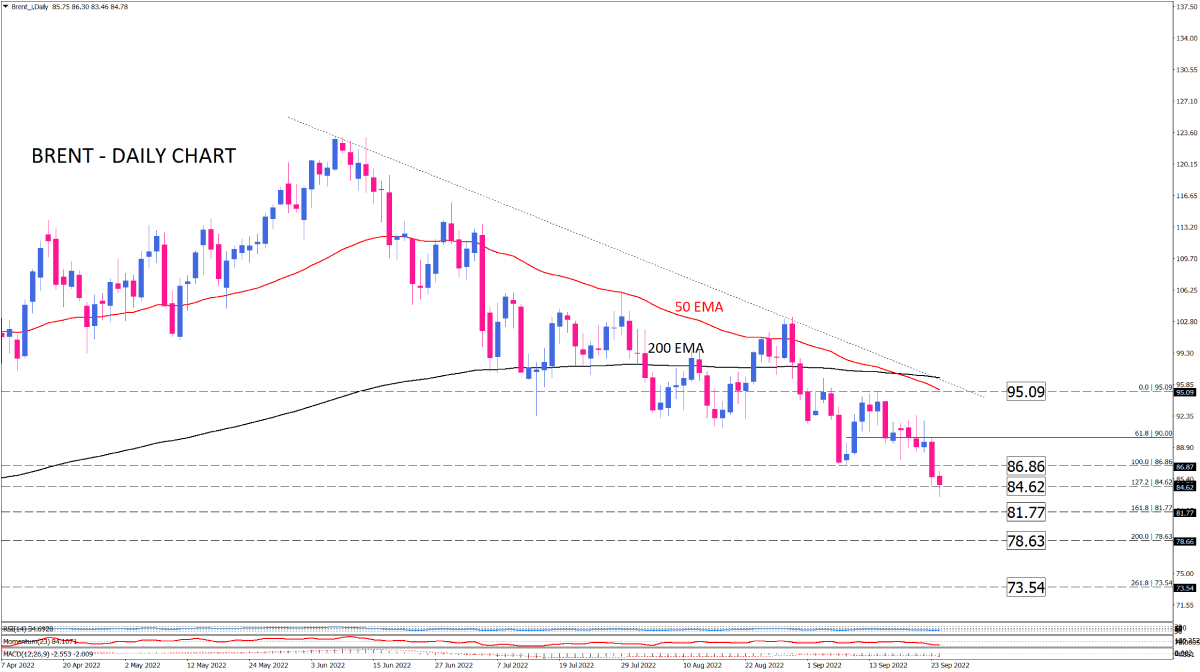
Brent drops to a fresh low in 2022
Since early June, Brent has been trading in a downtrend, making lower tops and lower bottoms. Brent reached a year-to-date low on Friday after breaking the $86.86 floor.
Meanwhile, the 50-day moving average has crossed below the 200-day, suggesting sellers are becoming stronger in the market.
We see that sellers are being challenged by the $84.62 support in Monday's trading session. If they are able to close below this support, then the estimate of the next possible support level against the price for the time being would be $81.77, which would correspond to the 161.8% level of the previous upswing from September 8-13.
In the event that the selling forces continue to strengthen, we can expect this price level to be broken and the market's attention will be directed toward $78.63.
If the downtrend continues, $73.54 will be the next support that awaits a price challenge.
The oil market is dominated by sellers based on short-term momentum oscillators. RSI has been swinging in the sell zone since Brent's downtrend began. This oscillator is currently moving downward and confirms that sellers are in a superior position. As a result, Momentum has followed a similar trend and is now deepening in a selling area. From the beginning of the downward trend, MACD bars have been in the negative zone, and they continue in that direction.

Technical Analysis
Discover ideal profit opportunities for your everyday trading with the help of our in-depth technical insights comprised of facts, charts and trends.


