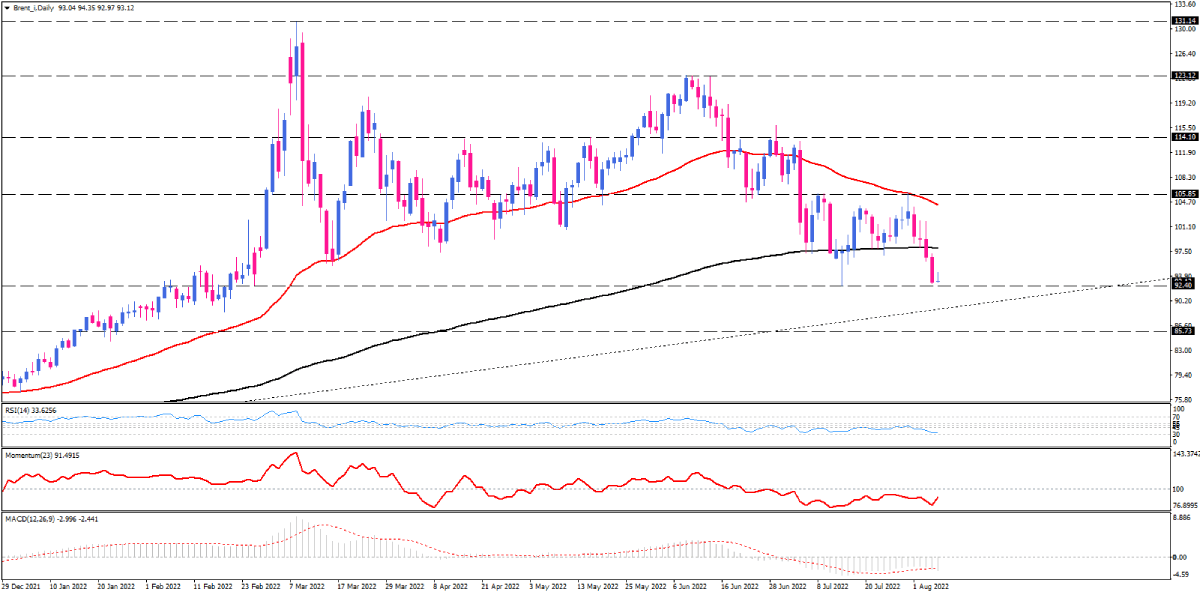
Brent is on track for the biggest weekly losses in five months
Brent on the daily chart is set to post its worst week since March 2022 after the price fell four days in a row. Recent recession fears contribute to lowering demand as most economic data suggest business activity is slowing down, and investors expect an imminent economic slowdown following aggressive monetary tightenings.
Brent has traded upward since April 2020. However, after buyers failed to continue the rally above $132, the uptrend lost momentum, dropping the price below the 50-day EMA.
Brent has been playing a range for a month. The oil price is hanging out at a crucial support level of $92.40, the lowest level in five months. Suppose sellers find enough strength to overcome this barrier. In that case, the decline could be extended toward the uptrend line that has held support for more than two years. If this dynamic support fails to limit losses, the subsequent fall will target $85.70.
Otherwise, should buyers retake control, crude can bounce off the trendline around $92.40 and make its way up to the range ceiling at $105.85, lining up with the 50-EMA. A sustained move above this hurdle can turn the outlook bullish again.
Short-term momentum oscillators support bearish bias. RSI is headed towards the 70-level. Momentum is moving in the selling area. MACD histogram has crossed below the signal in negative territory.

Technical Analysis
Discover ideal profit opportunities for your everyday trading with the help of our in-depth technical insights comprised of facts, charts and trends.


