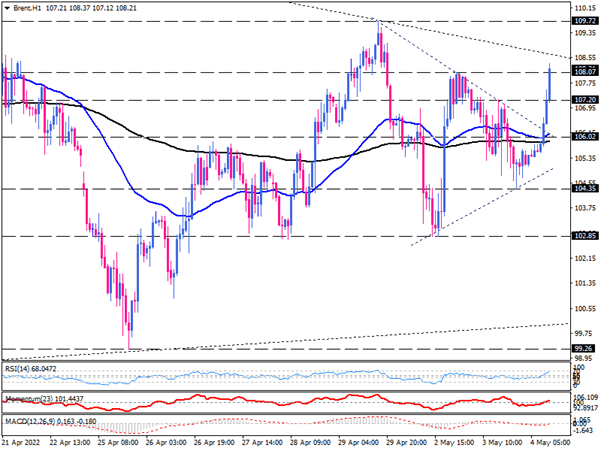
Brent picks up traction towards the week highs
Brent was trading sideways within a symmetrical triangle pattern on the one-hour chart. Now the price has broken above the dynamic resistance of this pattern, with buyers making traction above 107.20 at the previous market top, turning their attention to the week-top at the 108.07 mark.
Suppose they find enough strength to overcome this barrier. In that case, we need to evidence a decisive break above the greater triangle patterns from the higher time frame, which can result in sending the price to its two-week top of around 109.72.
Otherwise, if sellers retake control to defend this significant resistance zone, we may see some consolidation tending to retest the moving averages confluence near the 106 mark.
A the same time, momentum oscillators are picking up into the buying region. We see RSI is rising above the 50-baseline. And momentum is moving up at the verge of 100-threshold and may enter the buying region soon. Likewise, the MACD histogram shrank toward zero and is about to cross it if the positive momentum persists.

Technical Analysis
Discover ideal profit opportunities for your everyday trading with the help of our in-depth technical insights comprised of facts, charts and trends.


