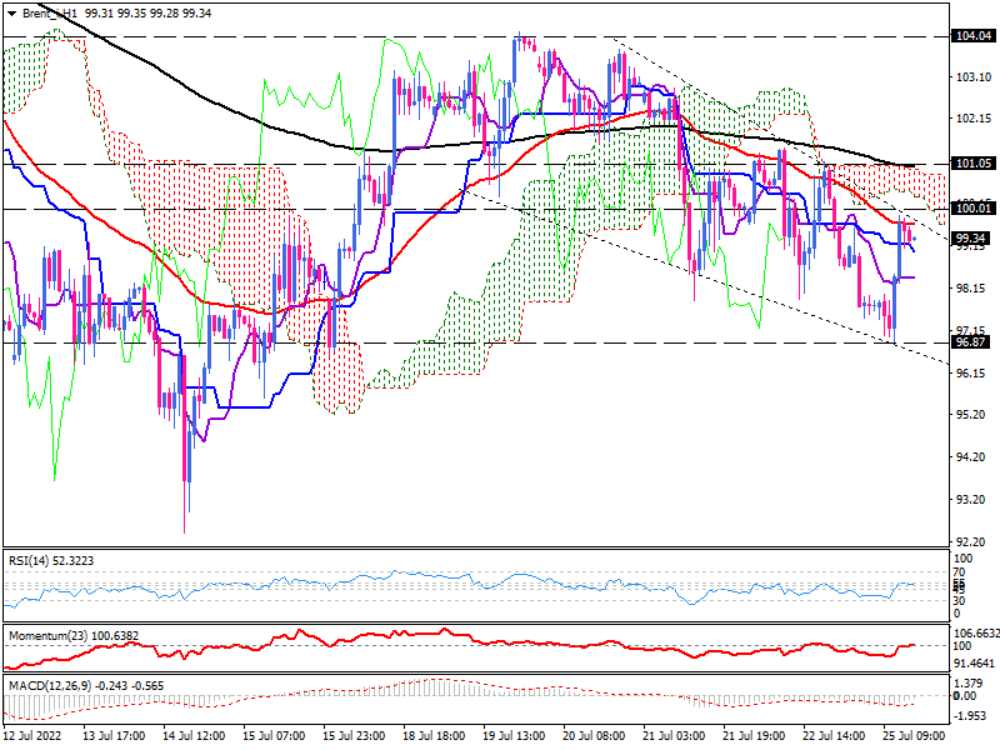
Brent prices are hanging out at key resistance
In Monday's trading session ahead of the opening of the US market, the Brent price is consolidating in a falling wedge pattern between a support level of 96.87 and a resistance level of 104.68 on the one-hour chart. The price is hanging out around the wedge resistance, which is in line with the 50-hour EMA. If the pattern holds, the price will bounce back towards the lower edge around a week low of $96.87.
Black gold is also moving below the Ichimoku Cloud, indicating a downward trajectory. Depending on the markets, The instrument can hold the downtrend even if upside traction pushes the price higher to test the cloud's upper border in confluence with the 200-period EMA before moving downwards to reach the weekly bottom at $96.87. A rebound from either the upper edge of the falling wedge pattern or the upper border of the cloud could also signal further decline.
The bearish scenario may be abandoned if the price breaks through the cloud's upper border and remains above $101.05. If this occurs, the pair may continue to rise towards $104.
Momentum oscillators indicate the lack of momentum in the current market. RSI is hovering at the boundary of its neutral zone with no directional indication. Momentum is also moving attached to the 100-threshold after recovering from lower readings. At the same time, MACD bars are shrinking in the negative region below the signal, which means selling pressures are losing steam.

Technical Analysis
Discover ideal profit opportunities for your everyday trading with the help of our in-depth technical insights comprised of facts, charts and trends.


