

CAD/CHF extends slide towards February lows
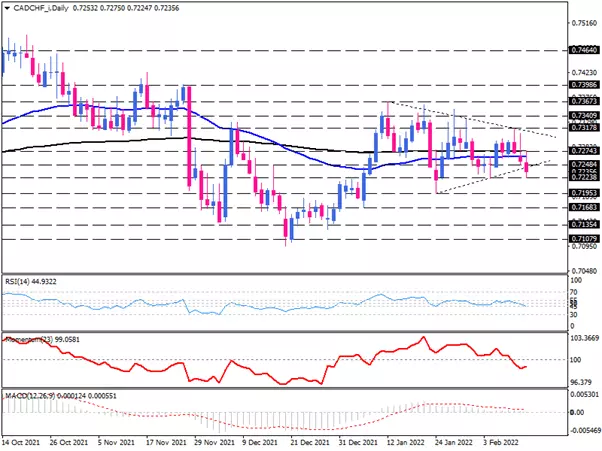
The daily chart shows that the CAD/CHF has consolidated in a triangle pattern. However, sellers have seized control of the pair, pushing its price under its 200-day exponential moving average to penetrate the lower edge of the pattern.
Bears are likely to close prices below the critical dynamic support area near the previous low at the 0.7224 hurdle, which is a crucial level to determine the future direction. Overcoming this barrier would send the price lower towards the 0.7195 mark. Hence, A further descending movement below this level could intensify selling pressure, aiming for January's price floor at 0.7168.
The short-term oscillators are conveying a mixed picture. The RSI is moving in the neutral territory while the momentum is trending downward below the 100-threshold. The positive MACD bar has fallen beneath the zero below its signal line.
Short-term view
The four-hour chart suggests that the selling tendency has increased as downside pressures have developed underneath the one-week low at the bottom of the 0.7248 mark. If the bearish momentum persists, the pair may attack 0.7224 again. A sustained break below this hurdle would lead to the lower support projected at 0.7195.
Conversely, if buyers find positive traction, initial resistance could commence from the previous bottom at 0.7248. With conquering this hurdle, the bulls could then test the resistance zone of flattening EMAs lining up with the 0.7274 mark.
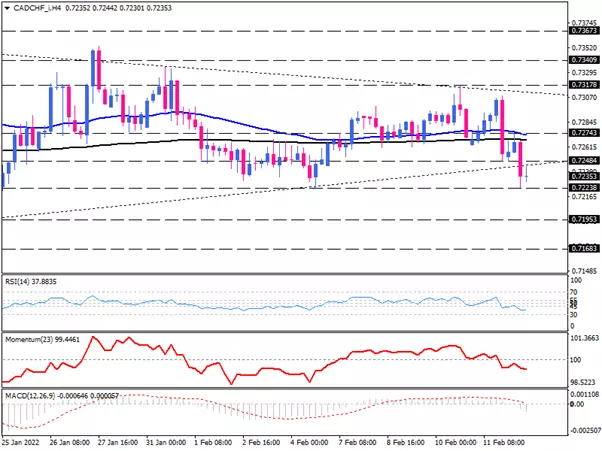
Short-term oscillators indicate prevailing bearish bias. RSI is pulling down in the selling region. Momentum is trending downward. And the MACD bar is dipping below the zero line.
Technical Analysis
Discover ideal profit opportunities for your everyday trading with the help of our in-depth technical insights comprised of facts, charts and trends.


