

Can bitcoin buyers overcome the 200-day EMA?
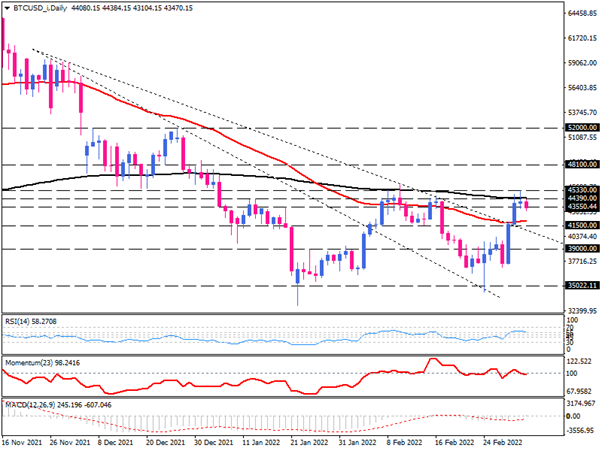
On the daily chart, bitcoin is trading sideways. We see after bottoming around 35K and pulling back to the broken trend line, buyers also penetrated the less sloping trend line. But the 200-day exponential moving average halted the upward movement earlier this week.
Yesterday's shooting star formation indicates the rejection of higher prices at the confluence of the 44390-resistance level and the 200-day EMA.
In the mid-day European trading session, sellers are attempting to drag the price below yesterday's low of 43550. With a sustained move in that manner, they will aim for the 50-day EMA that coincides with 41500 dollars. A further decline below this hurdle may result in penetration of the descending trend line. If that happens, the 39k may encounter the following support. The broad picture of bitcoin is bearish because it is trading below the slow-moving average. Still, the continuation of the long-term downtrend is subject to price dropping below the last bottom at $ 35,000.
Otherwise, should buyers successfully keep the ground above the 200-day EMA, the completion of a double-bottom pattern will be evident. If that's the case, the immediate resistance can rise from 48100.
Momentum oscillators convey selling forces are waning. RSI and momentum have posted a divergence between the price and oscillator. While MACD has crossed above the zero line into buying territory.
Short term outlook
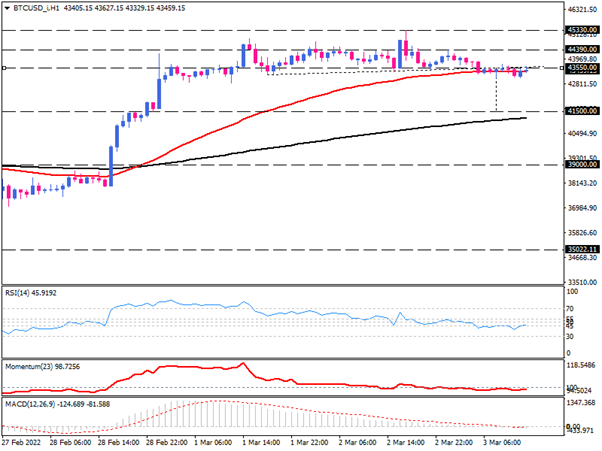
Looking at the short-term time frame on the hourly chart, we see the market sentiment is about to turn bearish by forming a Head and Shoulders pattern. Seemingly, more sellers may cue the broken neckline and crossover the 50-EMA. Once more, the classic projection of the head and shoulder roughly lines up with 41500 near the 200-EMA.
On the flip side, a sustained move above the right shoulder at 44390 will invalidate the reversal and may put 45330 on the buyers' radar.
Short term momentum oscillators indicate a prevailing bearish bias. RSI is trending down, pulling the neutral zone into the selling area. Momentum is moving below 100-threshold. And MACD bars are dipping below the zero line, while the signal line has also entered the negative territory.
Technical Analysis
Discover ideal profit opportunities for your everyday trading with the help of our in-depth technical insights comprised of facts, charts and trends.


