CHF/JPY bears are struggling with a crucial support
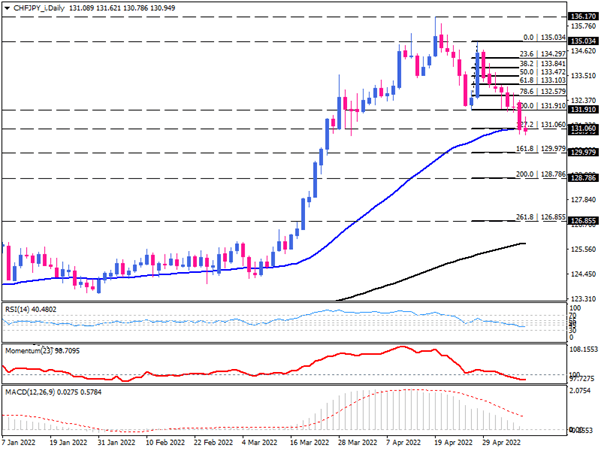
As we can see on the daily chart, the CHF/JPY pair has been in an uptrend since May 2020. After forming a reversal pattern by making a lower top at 135.034 on April 28, a broad sell-off has dragged the price towards the 50-day exponential moving average at 131.060, which also lines up with the 127.2% level of the last upswing.
While current Doji candlestick suggests that we need more clues to identify the next direction. Still, if bears manage to close the price below this hurdle, the down scenario would be more probable. Then, the immediate support could be projected at the 129.979 barrier, which aligns with the 161.8% Fibonacci extension. If the selling pressure continues, a decisive breakdown of this level could propel further decline toward the 200% level at 128.786. Overcoming this obstacle can send the price towards the next support level at 126.855.
Alternatively, suppose the 50-day EMA holds support. In that case, buyers may gain traction to capture the broken support level at 131.910, the previous market bottom. However, the bulls need to overstep the previous top at the 135.034 hurdle for the uptrend to resume.
Momentum oscillators support bearish bias. RSI has entered the selling area. Momentum is trending down below the 100-threshold. While positive MACD bars are shrinking on the verge of crossing below the zero-line.

Technical Analysis
Discover ideal profit opportunities for your everyday trading with the help of our in-depth technical insights comprised of facts, charts and trends.


