

CHF/JPY on the back foot after hitting a range resistance
A combination of factors led to the CHF/JPY reversing from its consolidation pattern's upper line, which prompted bulls to take some profits off the table. With a fresh wave of global risk-aversion, the yen has gained some support as a safe-haven currency.
Market sentiment remains fragile on the back of worries about a further escalation of the Russia-Ukraine conflict as well as China's latest outbreak of the COVID-19 virus. It appears that the recent optimism regarding a possible diplomatic resolution to end the war in Ukraine has been overshadowed significantly by these events, and that has led to a slide in the equity markets.
Technical view
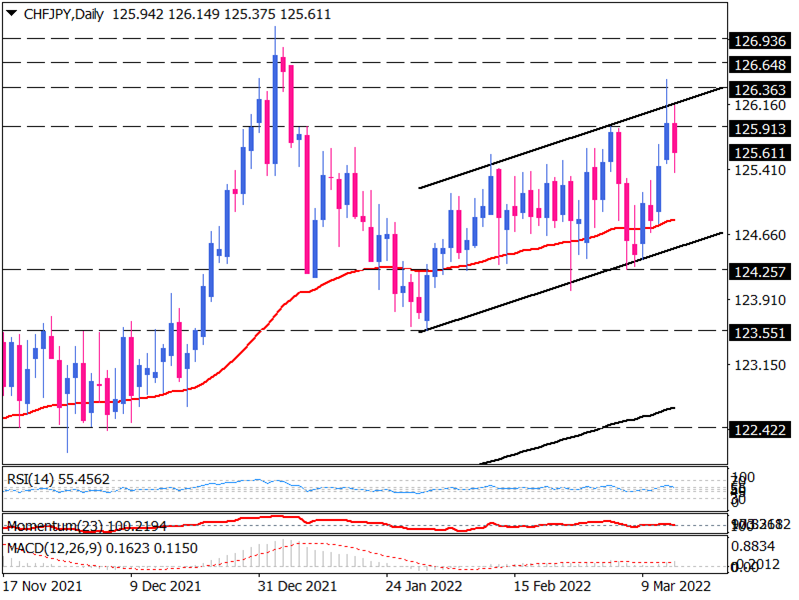
The pair has been trending upwards since 2020, trading above both the 50- and 200-day exponential moving averages on the daily chart. Having traded in a range, the price is now stuck in a flag pattern. It looks like a reversal is underway as buyers have failed to clear the 125.913 mark yesterday, which is right at the resistance of the current range. The price action suggests a downward reversal as sellers attempt to keep the price below the midpoint of today's range.
Suppose the sellers pay closer attention to that resistance zone. Thus, we can see that the CHF/JPY pair is trading back towards the flag support near the 50-day EMA and the last bottom at 124.257. More sellers will be drawn to the decline when there is a significant breach of this area. In that case, the next level of support would be the 123.551 barrier -- the low from January.
Alternatively, if the pair reaches 126.363, buyers may scale in, targeting the 126.648 barrier. In case the bullish Momentum pushes the price above this hurdle, a break to the upside can set the CHF bulls on track to capture the 7-years peak around 126.936, which aligns with a 161.8% Fibonacci retracement. Defeating this level of interest may pave the way for the uptrend to resume with a potential resistance level at 127.569 as an immediate target.
The momentum oscillators are indicating a mixed picture. RSI is in buying territory but is pointing downward, while Momentum seems to be slipping back towards the 100-threshold, which is a reflection of fading bullish bias currently. While we see the upbeat MACD bar has advanced up the signal line.
Technical Analysis
Discover ideal profit opportunities for your everyday trading with the help of our in-depth technical insights comprised of facts, charts and trends.


