Crude buyers pushing the prices to emerge a reversal
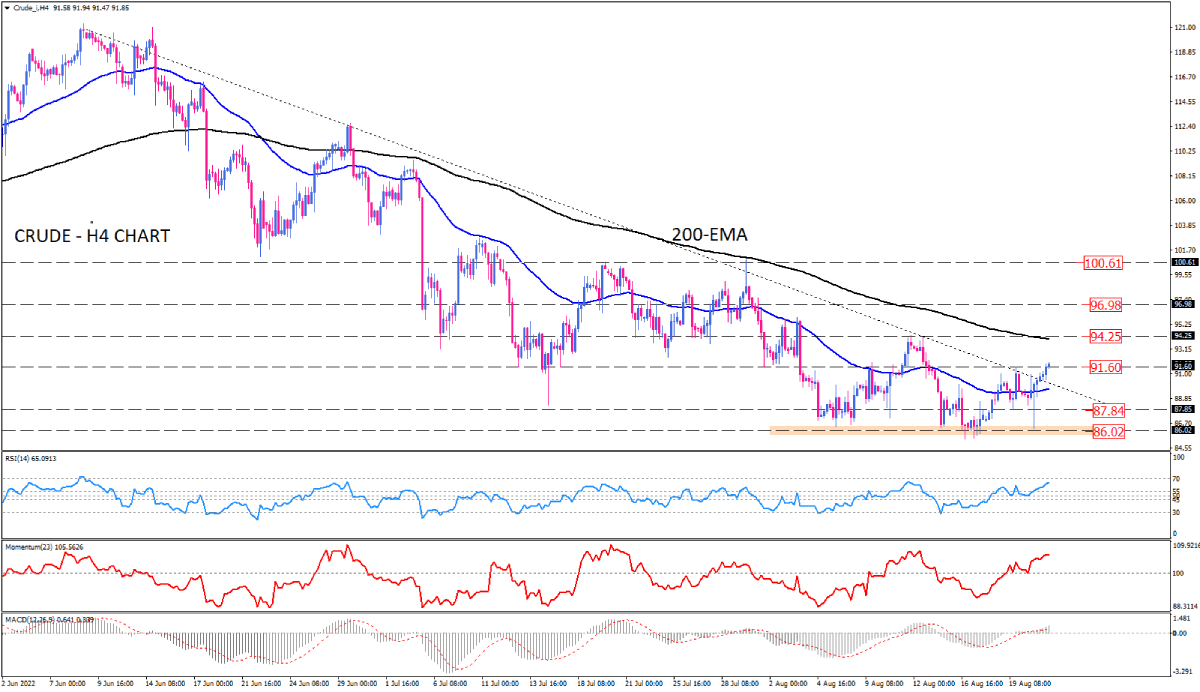
Recession fears and weakening demand worldwide have pushed the crude prices down as the market has been falling from $121.00 in early June to $86.00 in mid-August in a pure downtrend. However, the downtrend has lost momentum after several attempts failed to overcome the $86.00 support.
Crude on the four-hour chart is set to clear the one-week top at $91.60 on Tuesday after breaking the down trendline to the upside. The recent upside breakout now gets the 200 EMA under threat, which lines up with the major top at $94.25. Yet lower tops and lower bottoms convey the general downtrend is still in play.
If buyers succeed in dominating the market, a decisive break above the 200 exponential moving average would confirm the completion of a double-bottom pattern, hinting at a bullish reversal. In that case, the immediate resistance may confront the crude at $97.00.
Alternatively, should sellers defend Monday’s top at $91.60 at the end of the day, we can expect a retest of the broken trendline.
Short-term momentum oscillators favour the upside bias continuing. RSI is trending upward in the buying region, momentum is moving above the 100-threshold in buying zone, and MACD bars are growing taller, implying the difference between the two averages is increasing.

Technical Analysis
Discover ideal profit opportunities for your everyday trading with the help of our in-depth technical insights comprised of facts, charts and trends.


