
Crude Oil's Rally Pauses At Multi-Year Highs
On Tuesday, oil prices soared to their highest level since 2014, after tensions between Russia and Ukraine reached a climax as Moscow ordered troops into two breakaway regions of eastern Ukraine. Brent crude surged 3.60% higher to $97.00 a barrel, with WTI futures rallying 2.10% higher to $94 a barrel.
The United States and its European allies are poised to announce new sanctions against Russia in response. The addition of oil from OPEC+ is also unlikely for the time being. Like Saudi Arabia and the United Arab Emirates, Iraq has rejected calls for OPEC+ to increase its oil production substantially.
Daily Outlook
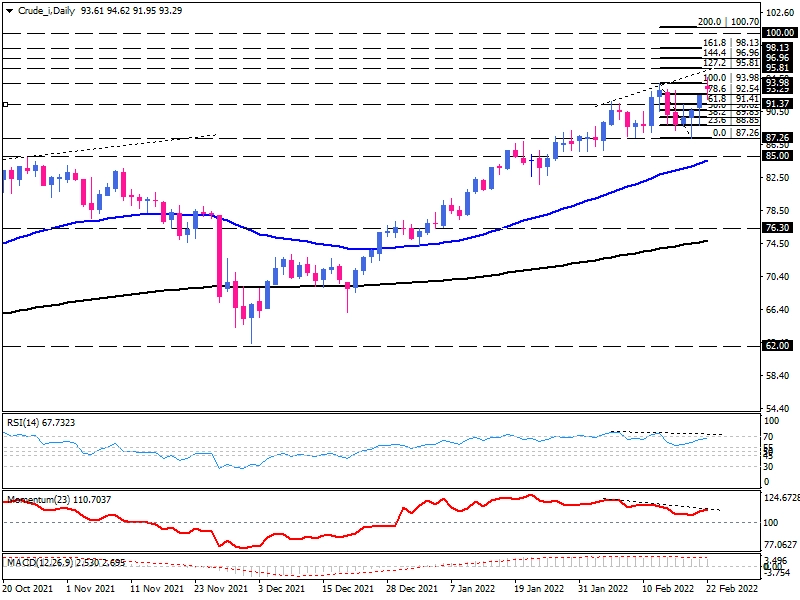
On the daily chart, after finding support around the $87.26 mark, the crude bulls are attempting to penetrate the last week's high, which is in line with the 7-year record high as well. Also, the gap between today's and yesterday's candlesticks represents the aggressively rising bullish sentiment due to escalating overnight tension in eastern Europe.
Suppose buyers manage to close the day above the previous top at $93.98. In that case, the immediate resistance can be found at the $95.81 barricade, which aligns with the 127.2% Fibonacci extension of last week's downward correction.
Further gains above this level will send the price towards the resistance region between $97 and $98 in the 161.8% Fibonacci extension vicinity. Overcoming this zone may put the $100 crucial psychological level in the spotlight.
However, momentum oscillators convey that bullish momentum is waning. RSI and momentum have posted a divergence with RSI reading slid below 70-level. It can interpret as buyers' exhaustion, and they may take a break at this point. Although, the momentum is advancing above the 100-threshold. We also see positive MACD bars flattening in line with the signal line.
Short-Term View
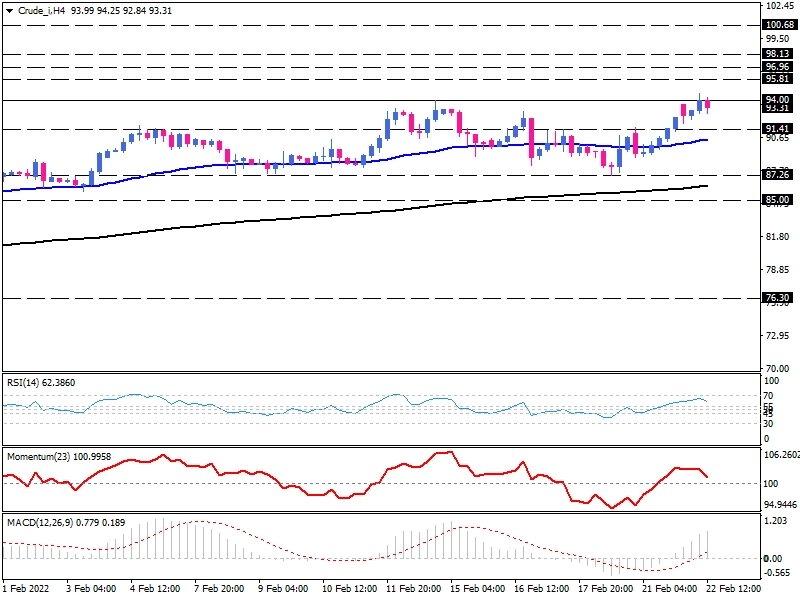
On the four-hour chart, we see the crude is extending upside momentum to pierce the $94 hurdle. If buyers close the European session above this level, the continuing upward movement will be evident. In that case, we can consider almost the same targets as the daily chart. Buyers may then eye $95.81, then $96.96, and $98.13 would be the next resistances before bulls throw a party at $100.
On the flip side, should selling pressures intensify, immediate support will be found at $91.41 and the 50-EMA. The further decline can result in retesting the swing bottom at $87.26.
Momentum oscillators support bullish bias. RSI is moving up towards the 70-level. Momentum is hovering in the buying territory. Though, it is pointing down, suggesting bulls may take a breather. And we see MACD bars are climbing sharply above the zero line. At the same time, the signal line has crossed the zero line in the previous session.
Technical Analysis
Discover ideal profit opportunities for your everyday trading with the help of our in-depth technical insights comprised of facts, charts and trends.


