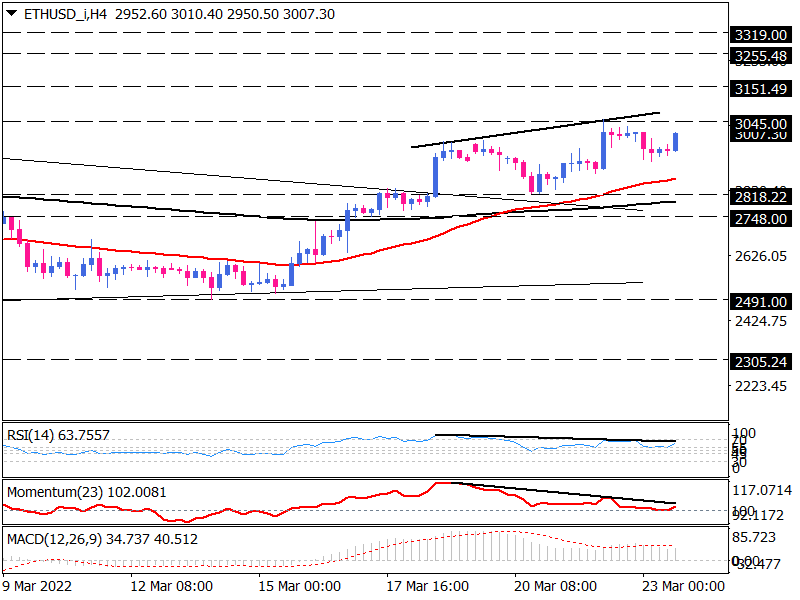
Ethereum bulls aim to clear one-month resistance
Ethereum bulls finally broke above the consolidation pattern on the 4-hour chart last Friday. Thursday trading session witnesses the rising moving averages support bullish momentum, particularly after the 50-EMA crossed over the 200-EMA. The price also appears to make higher tops and higher bottoms. Currently, the price of this cryptocurrency is fluctuating between the swing resistance of 3045 and the swing support of 2818. The outlook for the price would remain bullish as long as it remains above the EMAs. However, to maintain this uptrend, a clear breakout above 3045 must be seen, which has been a solid resistance level for over a month. Furthermore, this level coincides with the 127.2% Fibonacci extension of the previous downward swing, making it a critical level for the Ethereum coin.
Buyers will have more hope of gathering strength to rechallenge 3045 if prices bottom higher. Once bulls clear this area, the next hurdle could come from the 161.8% level at 3088. By holding above this barricade, the price will advance to 3151 and 3255, respectively, depending on the intensity of the move.

Nevertheless, short term momentum oscillators do not seem to support the prevailing bullish bias at this point. Both the RSI and the momentum have posted divergences by making lower tops. There is momentum attached to the 100-threshold, pointing down. A declining MACD bar is a sign of fading bullish sentiment, as it shrinks below the signal line.
Therefore, if sellers take their cues from divergent oscillators to enter the market, the price can fall to meet the 50-EMA. As a result of the failure of the fast EMA, 2818, which coincides with the 200-EMA, may serve as support. Defeat below this hurdle, and the broken triangle line may change the outlook to bearish.
Technical Analysis
Discover ideal profit opportunities for your everyday trading with the help of our in-depth technical insights comprised of facts, charts and trends.


