

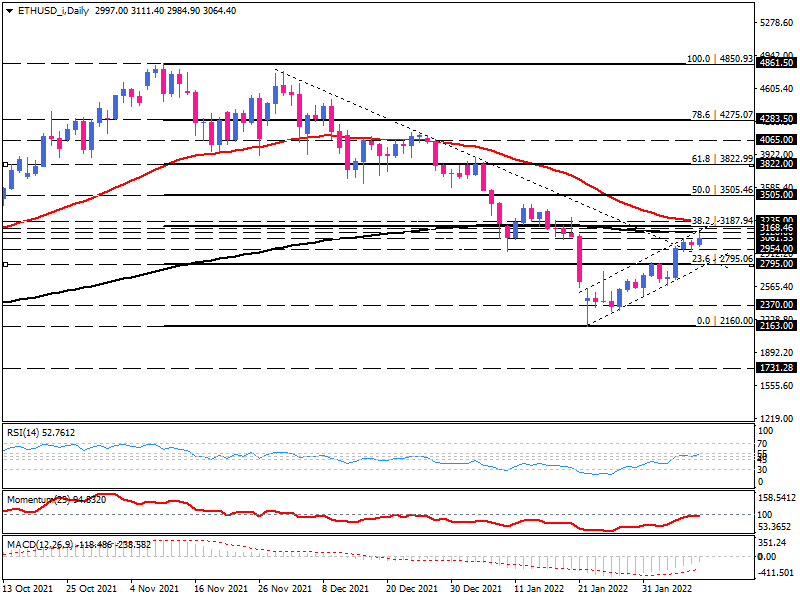
Ethereum pierced the bearish breaker towards the 200-day EMA
As can be seen on the daily chart, Ethereum has been running downward since the first of December 2021. If we draw a down trendline by connecting the lower tops, we see buyers managed to penetrate the trendline last week to strengthen the possibility of a bullish reversal. Now, as they crossed Thursday's high, prices are pushing higher towards the 200-day moving average.
It seems buying forces still need to prevail further to overcome this obstacle. Momentum oscillators show the selling pressure is fading but have not yet provided evidence of buyers dominating the market. The RSI has pulled up from the oversold territory to the neutral zone, but the momentum is still hovering in the selling area below the 100-threshold. Negative MACD bars also confirm the waning negative bias by shrinking towards zero.
Yet, buyers must overstep the $ 3128 for the uptrend to continue. In that scenario, the price may enter a crucial resistance area between the 200-day and 50-day EMAs, including 38.2% Fibonacci retracement. Prevailing bullish momentum over the 3235 hurdle might pave the way towards the next target at 3505, which aligns with the 50% Fibonacci level. A possible uptrend would have its next resistance area in the range of $ 3822 and 4065, respectively.
On the bearish side, if sellers retake control of the market, the crypto price could retrace back to the broken trend line. This would match the 23.6% Fibonacci retracement level at $ 2795. A sustained move below this level will draw sellers' attention to the next support area between $ 2370 and $ 2160 around the seven-month price floor.
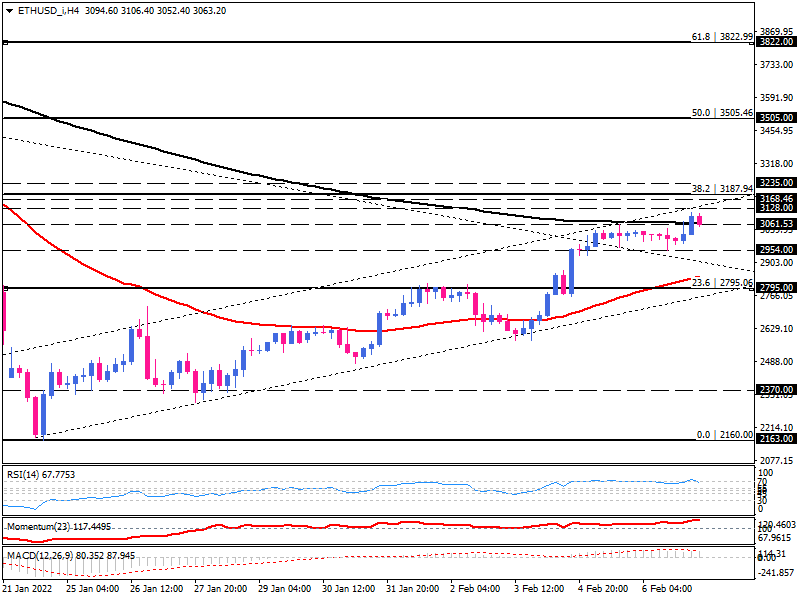
Short-term view
At the 4-hour timeframe, Ethereum is trading within an ascending channel. Having broken out of the range above $3061, aligning with the 200 EMA, it appears the upper edge of the channel around $3128 is limiting further upward movement.
A short-term correction could bring the price down to $ 2954. When this barrier is overcome, the decline may continue along with the broken falling trend line at the lower edge of the channel.
Also, momentum oscillators suggest that buyers are likely taking a breather. The RSI is in the overbought zone, and the momentum is pointed down from the peak. Meanwhile, the positive MACD bars flattened below the signal line.
Technical Analysis
Discover ideal profit opportunities for your everyday trading with the help of our in-depth technical insights comprised of facts, charts and trends.


