

ETH/USD selling pressures escalating at a key support level
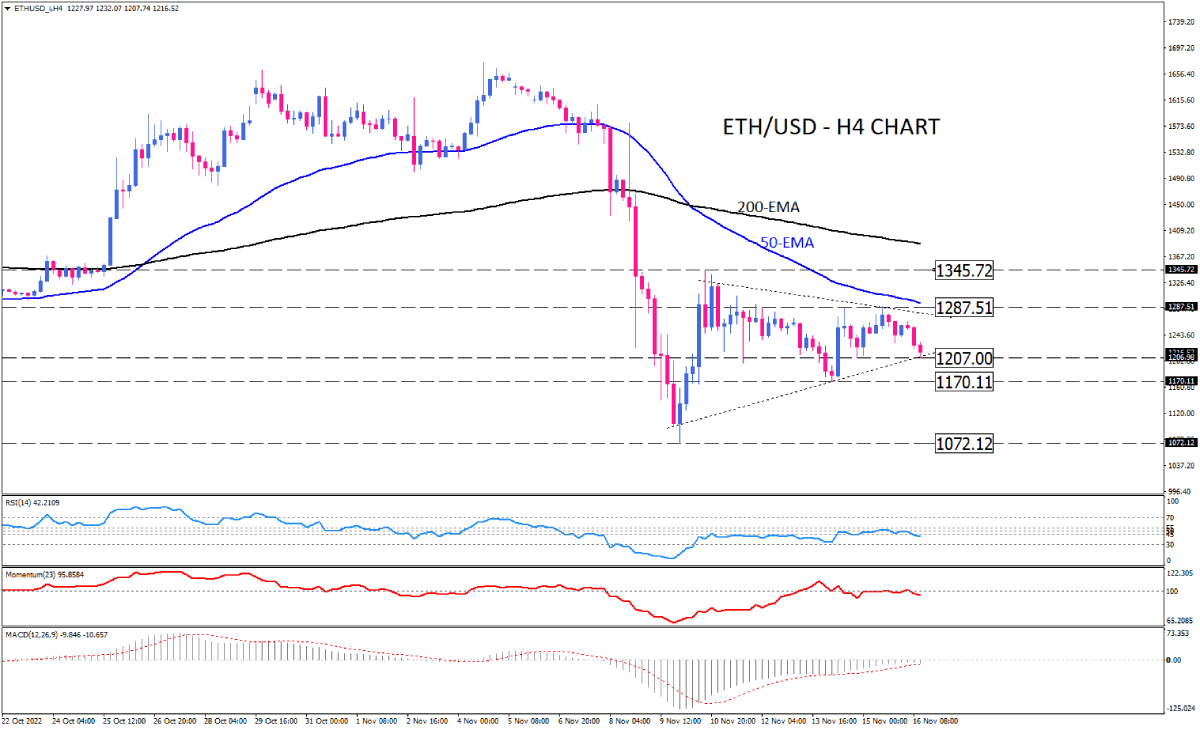
Ether is trapped in a consolidation pattern on the 4-hour chart. Having retreated from pattern resistance at 1287.50, sellers have taken a downward path towards the psychological support area of 1207, which can also be thought of as the bottom of the pattern.
For the fifth time ever, ether is encountering the boundaries of a triangle pattern, which will determine the direction that it will take in the future. In the event that the bearish momentum lasts, sellers will be able to overcome this support and break the pattern down, which could trigger a new round of declines, leading to the next support at $1170. The cryptocurrency could easily fall back to last week's low of 1072 if a sustained break of this barrier occurs.
By contrast, if the lower boundary of the pattern is maintained, the sideways trend will continue toward the upper line of the triangle. Buyers must break through an extremely substantial resistance zone in front of the price to turn the trend bullish and push it past 1287.51 since this area coincides with the confluence of the previous top, the pattern upper line, and the 50-day exponential moving average.
Short-term momentum oscillators also reflect a sideways trend by presenting a mixed picture. RSI appears to be slowly slipping away from its neutral zone. Following a period of horizontal movement beneath its 100-threshold, momentum is also trying to move further into the sell zone. Negative MACD bars are also melting towards zero and indicating the convergence of the moving averages, which indicates a weakening of the market's directional momentum.
Technical Analysis
Discover ideal profit opportunities for your everyday trading with the help of our in-depth technical insights comprised of facts, charts and trends.


