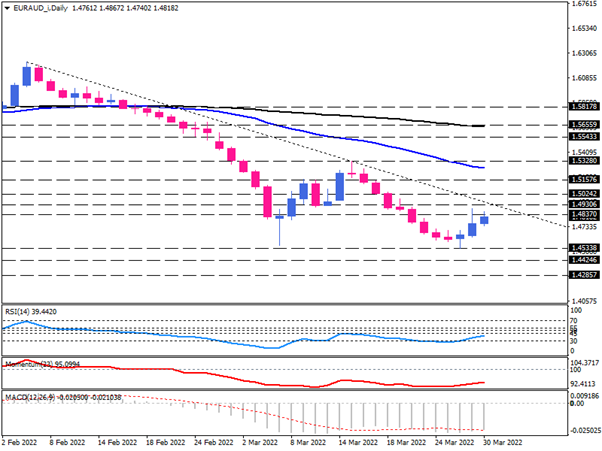
EUR/AUD bulls heading for reversal at falling trendline
Euro on the daily chart, started the week strengthening against the Australian dollar, as buyers cut further losses around the 5-year low and bottomed at 1.45338, putting the pair on its third consecutive rising day. This is a sign of fading bearish momentum, which can keep buyers hopeful for a bullish reversal.
The 38.2% Fibonacci retracement of the last down leg at the 1.48370 mark has come into the spotlight as the pair gains traction.
Suppose buyers find enough strength to overstep this barrier. In that case, the next resistance is estimated at the 1.49306 mark, which lies on the 50% retracement level. If positive momentum persists, buyers can overcome this hurdle, which results in penetration of the falling downtrend line and breaking through the 1.50242 resistance level at 61.8% Fibo level. This is a critical roadblock in the bulls' attempt to turn the trend upward. As they become able to cross this barrier, they must clear 1.51576 first to reclaim the 1.53274 mark, which is the last top made on March 15. Overstepping this critical level of resistance that coincides with the 50-day EMA will signal the completion of a double-bottom pattern and pave the door toward the higher targets.

However, if the descending trendline holds resistance, the pair will likely consolidate between 1.49306 and 1.45338 before taking a clear direction. A sustained move below the previous bottom at 1.45338 will signal the resume of the prior downtrend, with sellers aiming for the lower supports around the 1.44246 and 1.42857 mark, respectively.
Momentum oscillators reflect fading bearish bias. RSI is climbing from the oversold area, indicating that sellers are taking a breather. Momentum is heading north from its extreme lows. Likewise, the negative MACD bars are shrinking. Moreover, a tentative divergence is being observed in the RSI, Momentum, and MACD.
Technical Analysis
Discover ideal profit opportunities for your everyday trading with the help of our in-depth technical insights comprised of facts, charts and trends.


