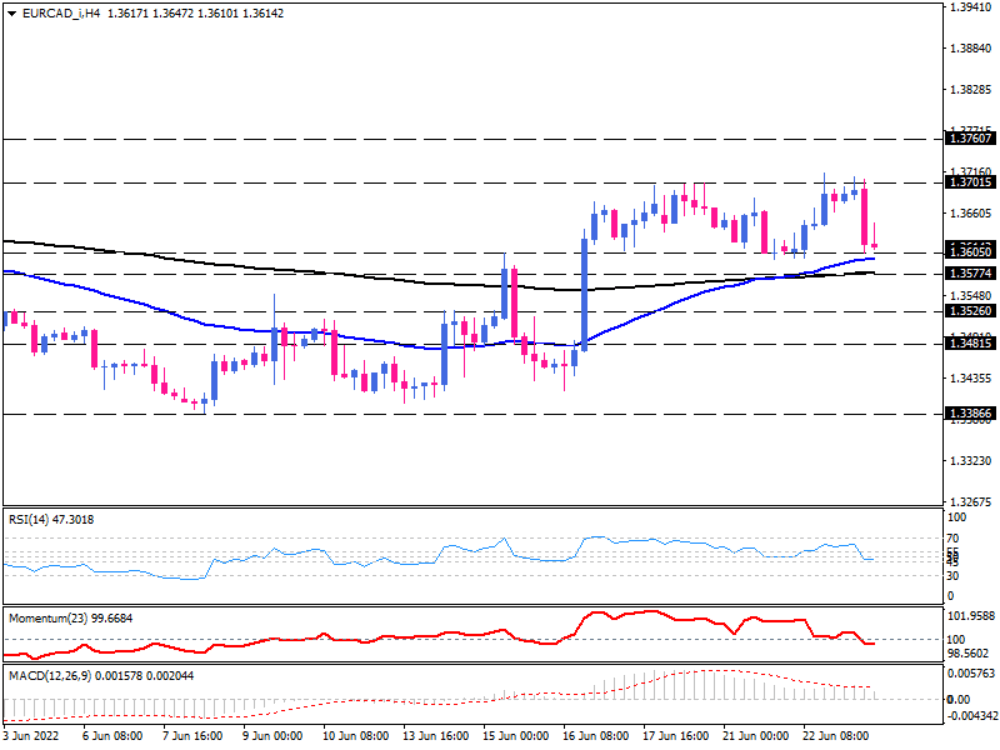
EUR/CAD settled on a crucial support
On the four-hour chart, EUR/CAD has been pacing back and forth between support at 1.36050 and resistance around 1.37015. After a sharp bounce off the top in the European morning session, the price has settled back to the bottom of its range. It might be a retest of the 50-EMA, which has been picking up above the 200-EMA. Bulls may fasten their belts for another pullback towards the top if they take a cue from this crossover. However, a clear directional signal would take place once the market successfully breaks its sideways pattern to either direction.
If sellers continue to dominate the market, EUR/CAD can head lower. A break below the 1.36050 will also drag the price below the 50-EMA. Bears may then allow the 1.35775 handle on the 200-EMA to keep losses in check. A further drop will turn the outlook bearish, with sellers aiming for 1.35260.
Otherwise, suppose the range’s support can hold. In that case, the price can move higher towards the 1.37015 barrier. If bullish momentum continues to prevail, bulls will remain in charge. That can lead to a decisive break above this hurdle, paving the way towards 1.37600, which marks a two-month resistance level.
Short-term momentum oscillators hint at a fading bullish bias. RSI is moving down in the neutral zone. Momentum has fallen below the 100-threshold, suggesting sellers are gaining momentum. MACD bars lower below the signal line towards the zero-line, implying a weakening buying bias.

Technical Analysis
Discover ideal profit opportunities for your everyday trading with the help of our in-depth technical insights comprised of facts, charts and trends.


