

EUR/USD at a Crossroads: Triangle Pattern Signals Pivotal Moment
In the vast world of forex, the EUR/USD pair has been painting an intriguing picture on the canvas of the H1 timeframe. The pair is currently trading within the confines of a triangle pattern, a formation that often signals a potential breakout in either direction.
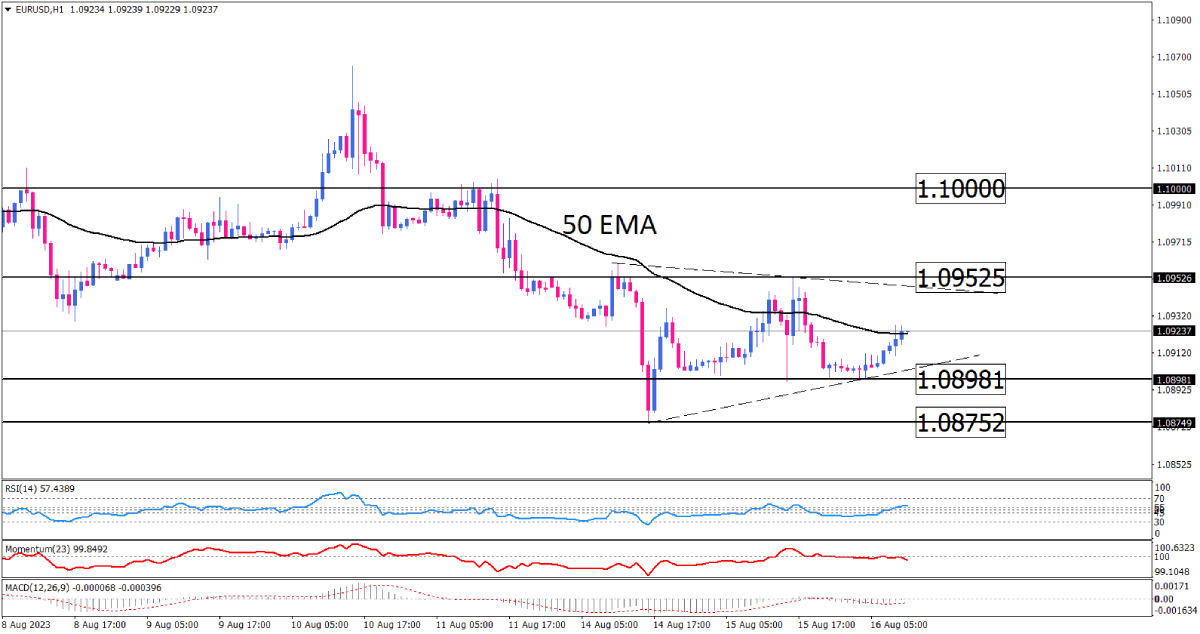
After a recent brush with the lower edge of this pattern at 1.08981, the EUR/USD has been making strides upwards, eyeing the upper echelon of the triangle, which sits tantalizingly close at 1.09525. This movement has traders and investors on the edge of their seats, as the next steps of this currency pair could dictate the market's direction for the coming days.
The Bullish Tale: Breaking Boundaries and Rising Highs
The main narrative that's capturing the attention of many is the potential for an upward movement. For this to come to fruition, the buyers have a task at hand: they need to muster enough strength to break above the triangle pattern. Achieving this would not only signal a bullish dominance but also set the stage for the pair to target the 1.10 mark. This scenario is further bolstered by the RSI oscillator, which is venturing out of its range and stepping confidently into the buying zone.
The Bearish Narrative: Resistance, Pullbacks, and Downward Drifts
However, every story has two sides. The alternative scenario paints a picture where the triangle's resistance proves too robust for the bulls. If this resistance holds its ground, market participants could witness a pullback towards the 50 EMA. But the bears have their work cut out for them. To maintain a downtrend and keep the bearish narrative alive, they would need to push the pair below the crucial 1.08752 mark.
Oscillators Weigh In: Signals from the Depth of the Market
Diving deeper into the technical indicators, the momentum oscillator seems to be playing it coy. It doesn't yet show a strong traction to the upside, hinting at a market that might continue to move sideways. It's hovering around the critical 100 threshold, suggesting a state of equilibrium between the bulls and bears.
Meanwhile, the MACD, a favorite among many traders, is showing negative bars that are gradually shrinking towards the zero line. This is a clear indication that the bearish pressure, which once dominated the scene, is waning. The implication? The EUR/USD pair might just have the wind at its back to continue its upward journey.
In Conclusion
The EUR/USD is at a pivotal juncture. With the triangle pattern in play and oscillators giving mixed signals, the market is ripe with opportunities for both short-term traders and long-term investors. Whether you're rooting for the bulls or bears, one thing is certain: the coming sessions promise to be filled with excitement and potential. Stay tuned, and may the charts be ever in your favor!
Technical Analysis
Discover ideal profit opportunities for your everyday trading with the help of our in-depth technical insights comprised of facts, charts and trends.


